All work

4 min read

ImmoScout24 · 2021

Seeing how a listing performs, without having to ask.

A redesigned Ad Statistics dashboard on ImmoScout24, where advertisers can track how their listings perform and compare them with similar properties.

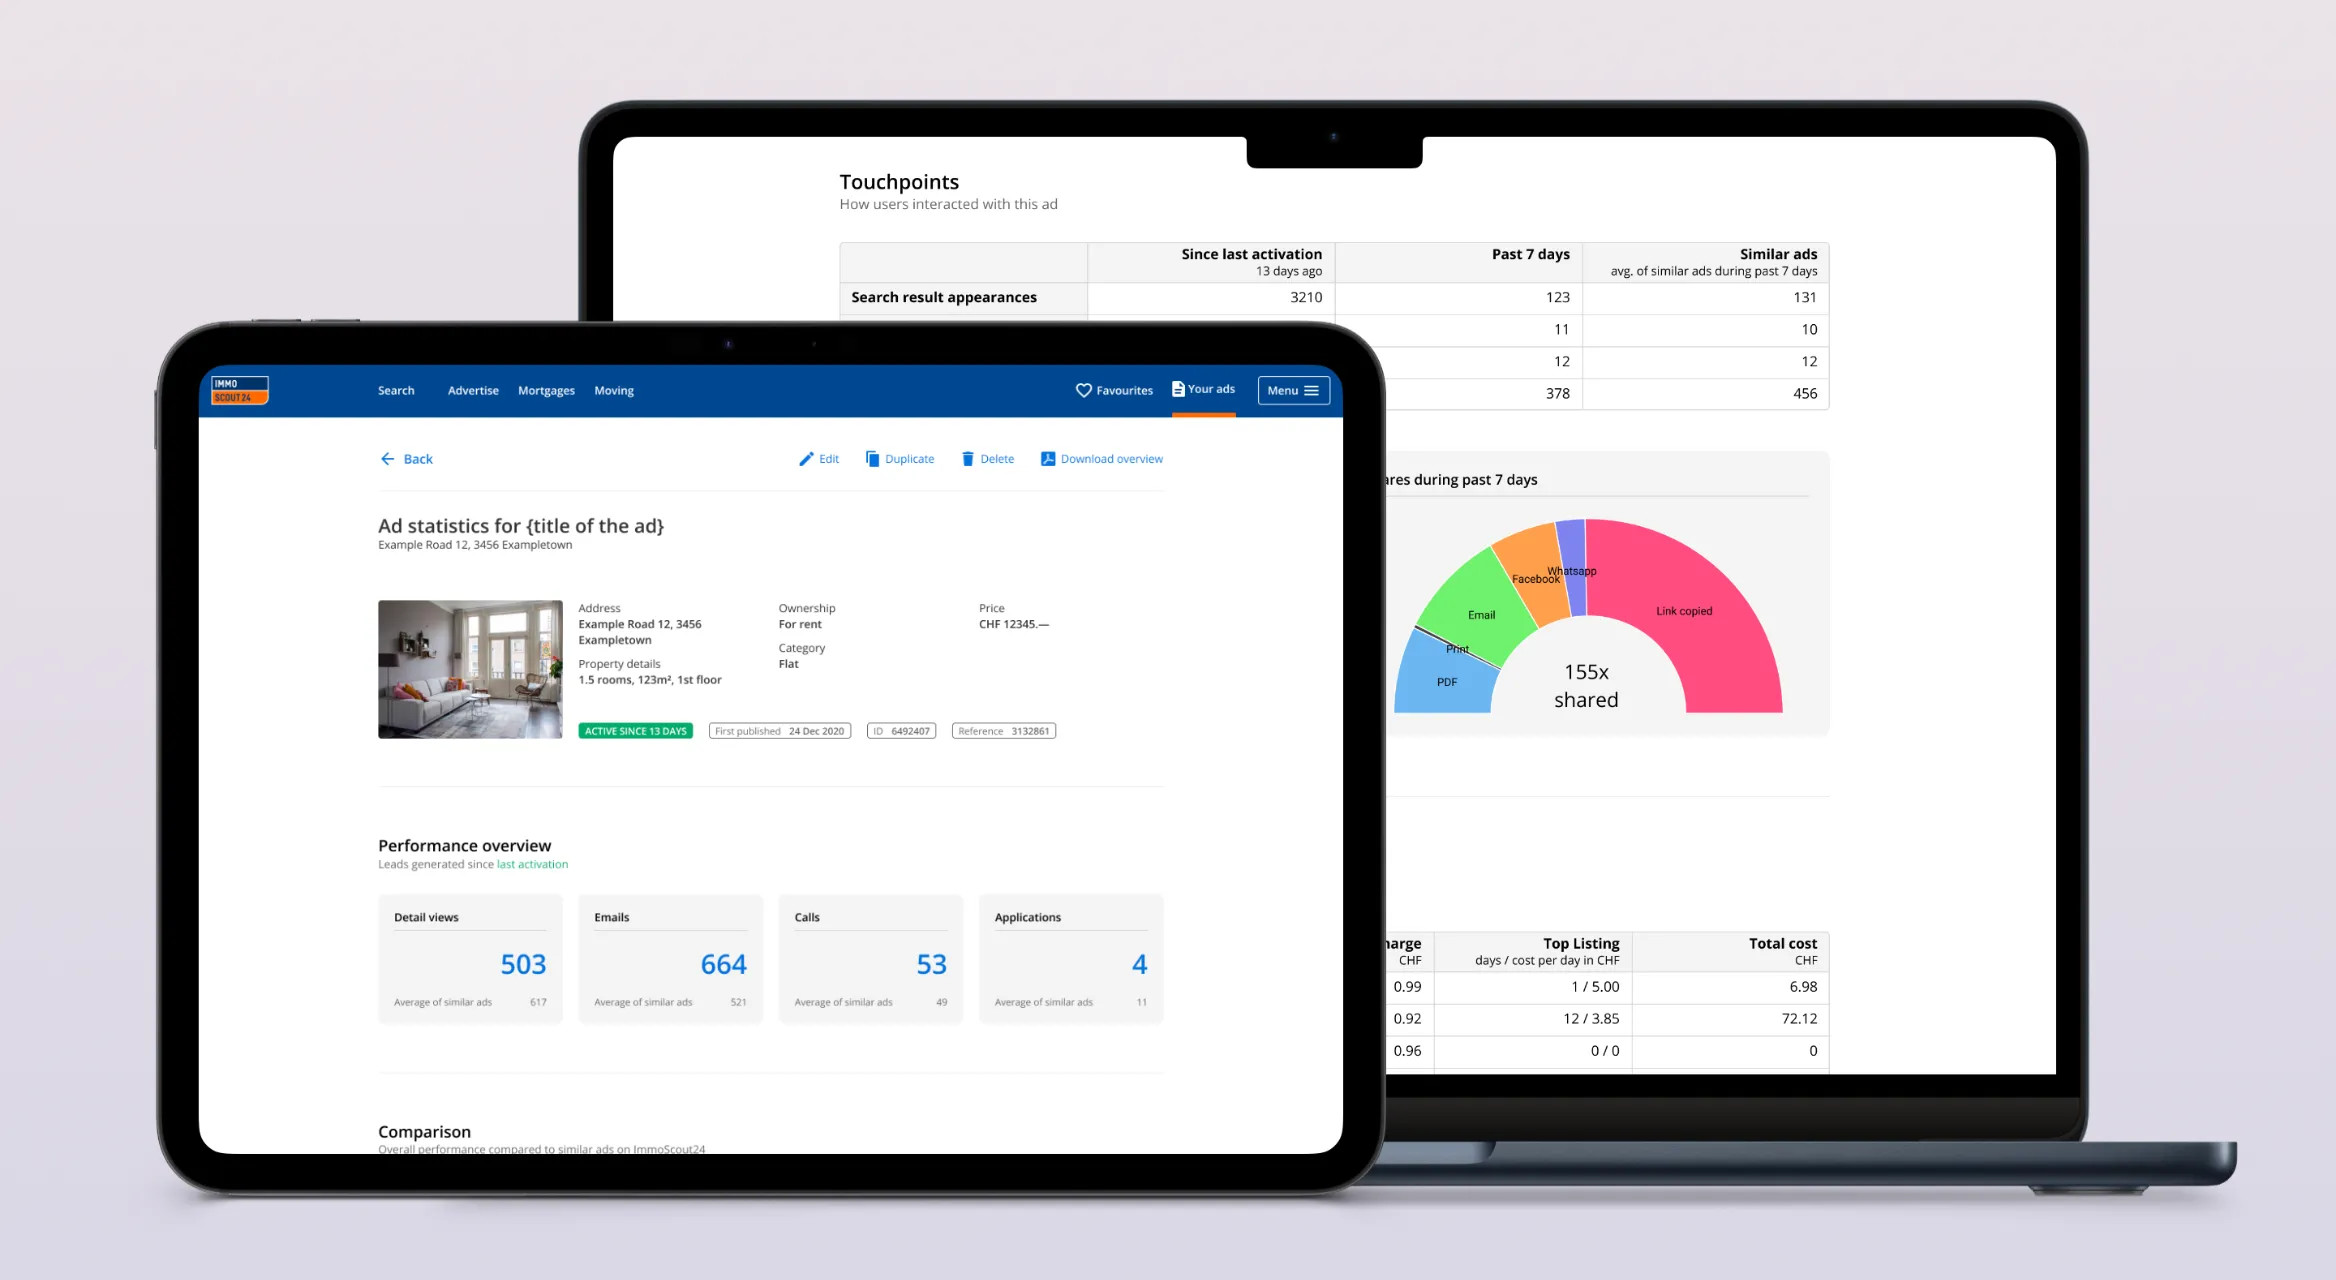
Enlarge image: The redesigned Ad Statistics page on a tablet and a laptop. The tablet shows the ad’s photo and details and four performance overview cards for detail views, emails, calls and applications, each with the average of similar ads. The laptop behind it shows a touchpoints table, a semicircle chart of 155 shares by channel, and a cost table.
The redesigned Ad Statistics dashboard.

At a glance

Advertisers on ImmoScout24 range from large agencies to private owners renting out a single flat. For years, most of them learned how their ads were performing through info emails or a call from sales. Larger companies could see the numbers once they were synced into their own management tools. Everyone else had little to go on.

I redesigned Ad Statistics into a dashboard where advertisers can track a listing’s performance themselves, compare it with similar properties and dig into the details.

Client
ImmoScout24 Schweiz
Industry
Swiss real estate marketplace
My role
Product Designer
Year
2021
Platform
Web, Mobile
Tools
Figma
Deliverables
User journey, wireframes, prototype, UI design

The challenge

Numbers without context.

Information about performance was scattered across emails, phone calls and, for some, third-party tools. Even advertisers who had the numbers couldn’t tell whether they were good or bad for their kind of property, or why one ad was doing well and another wasn’t.

That also made it hard to judge whether a paid add-on was worth buying. Without a baseline, there was no way to see what it had actually changed. The goal was one place where any advertiser, from a large agency to someone with a single property, could see how a listing is doing, what’s normal for comparable listings, and how that changed over time.

Approach

From a list of numbers to something you can read.

More than just a snapshot.

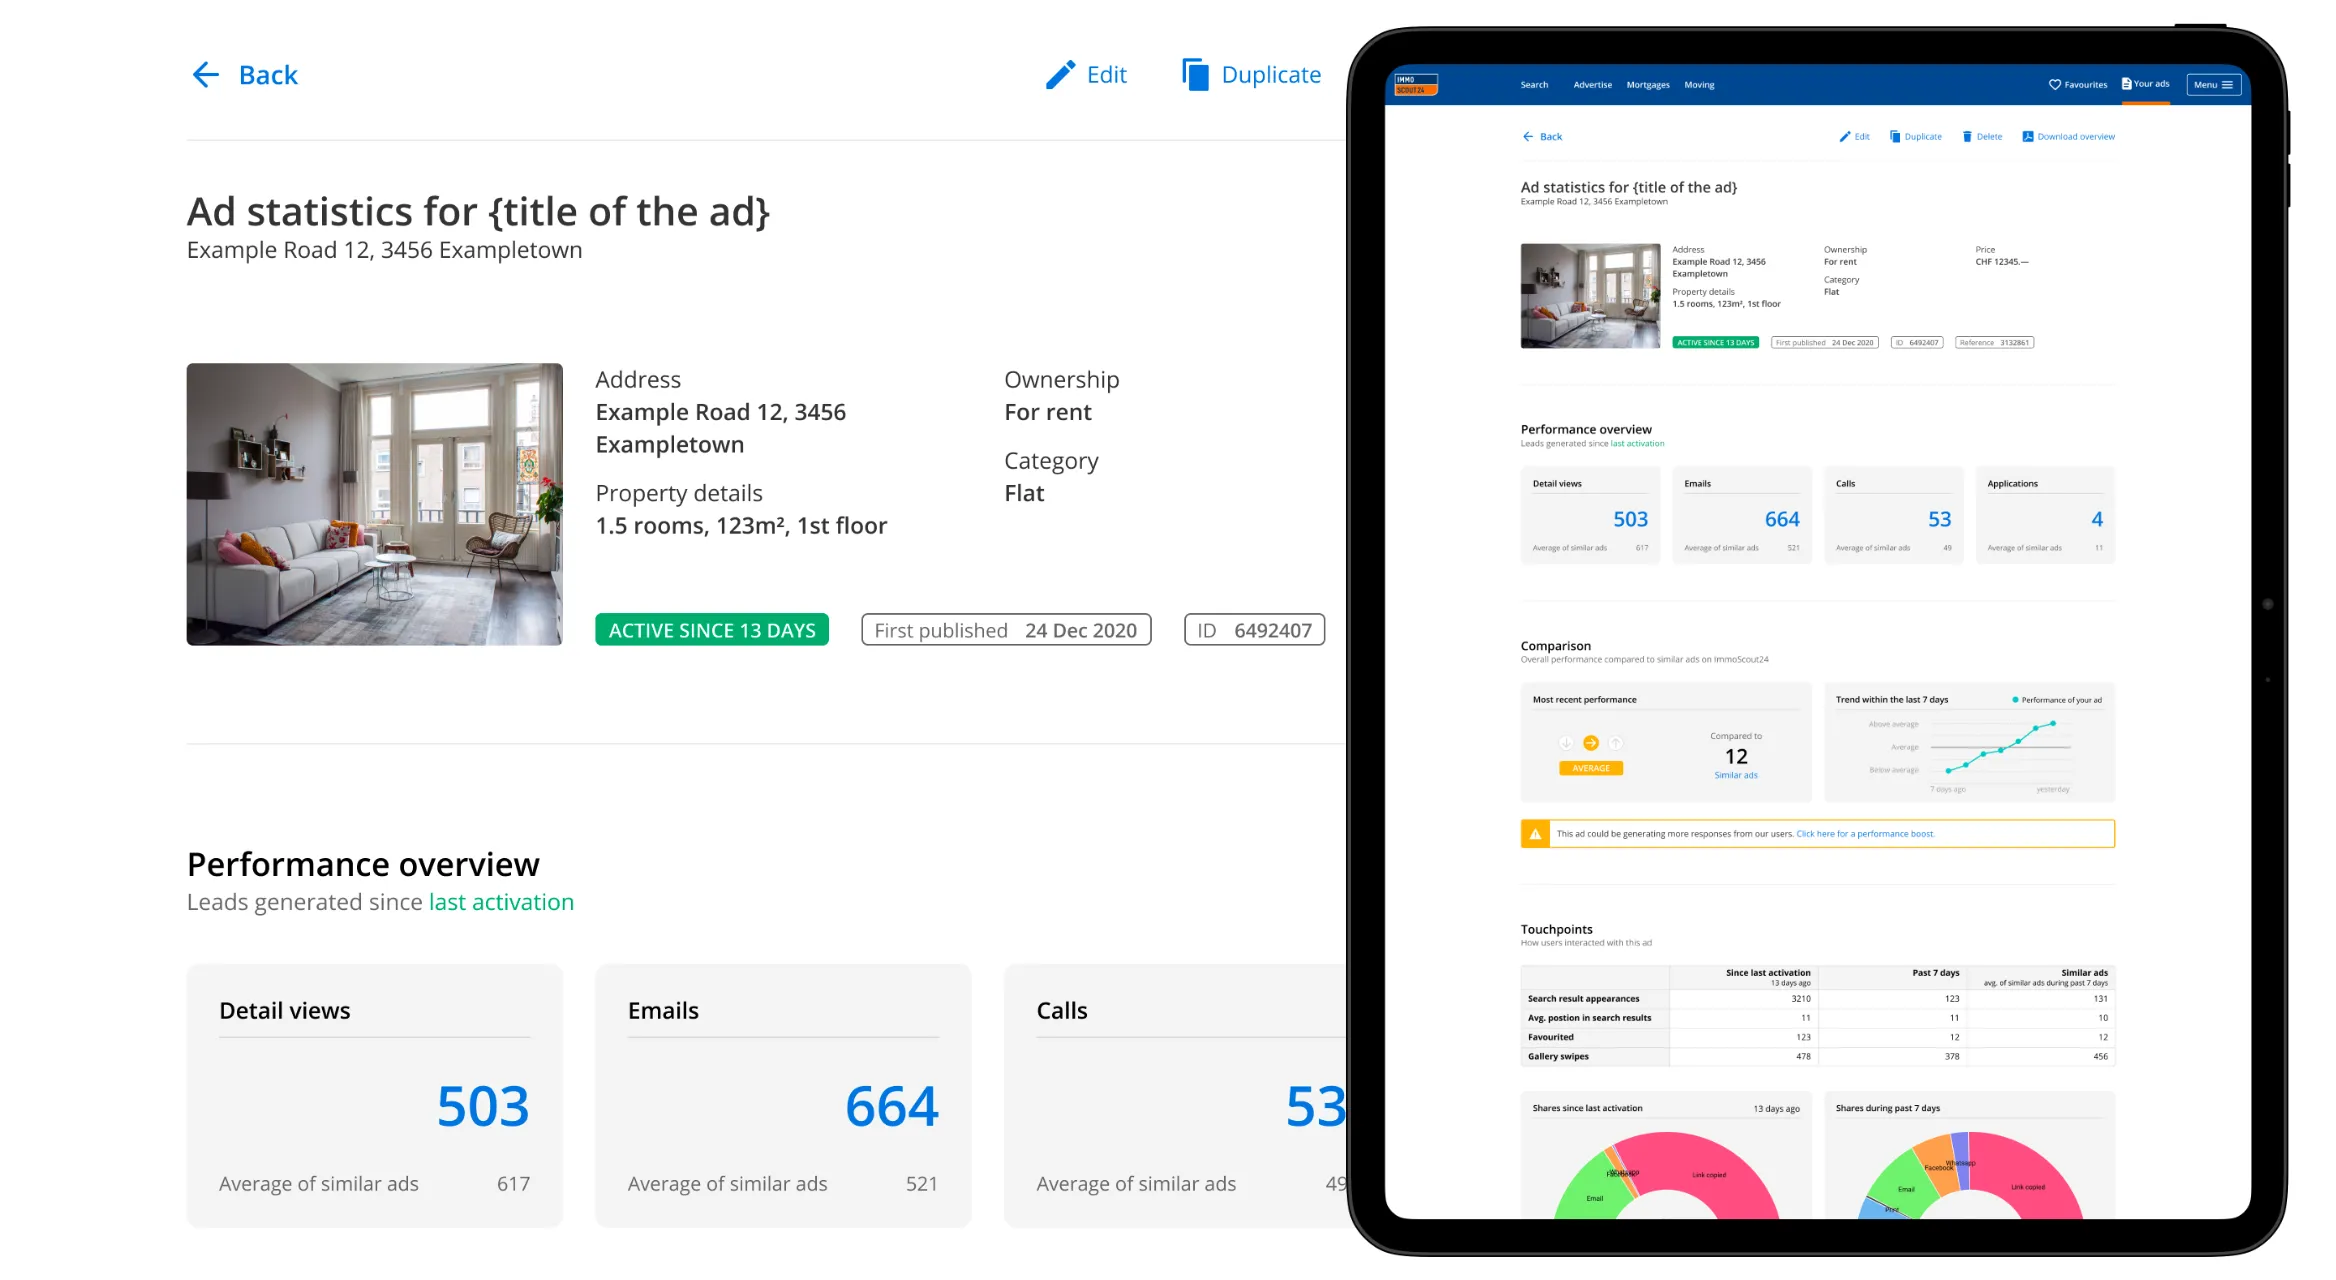
The performance overview cards now show each figure next to the average for similar properties. A number on its own says little. Next to a benchmark, advertisers can see at a glance whether a listing is ahead or falling behind.

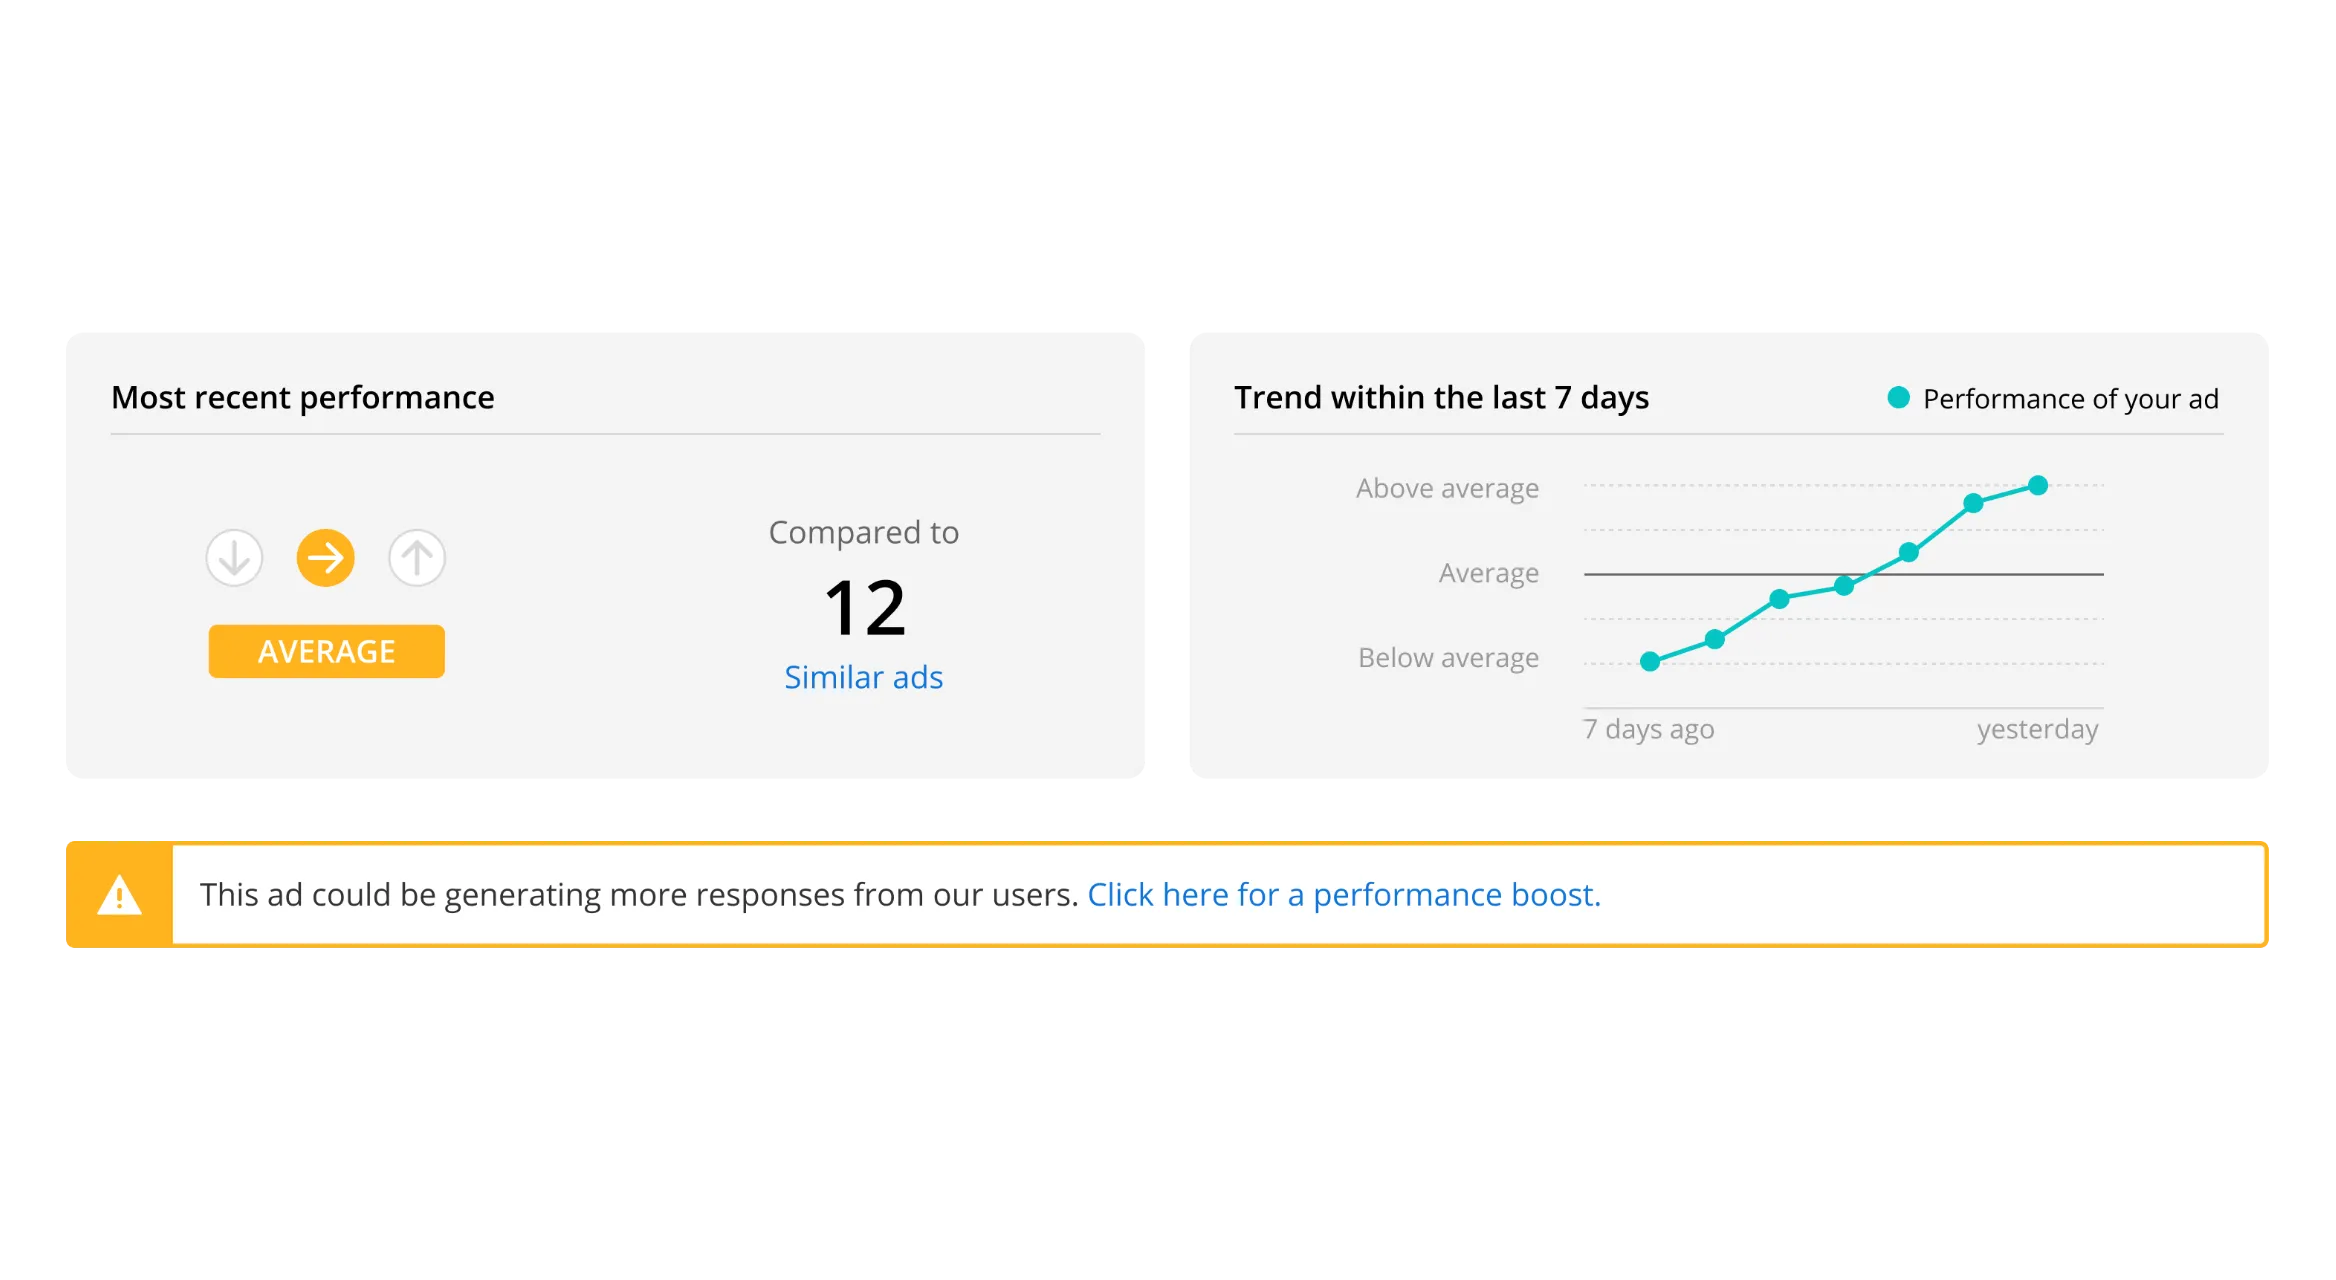
A new comparison section shows how a listing has performed over the last seven days. It turns a single reading into a direction, and makes it possible to spot the effect of a change, like adding photos or booking a boost.
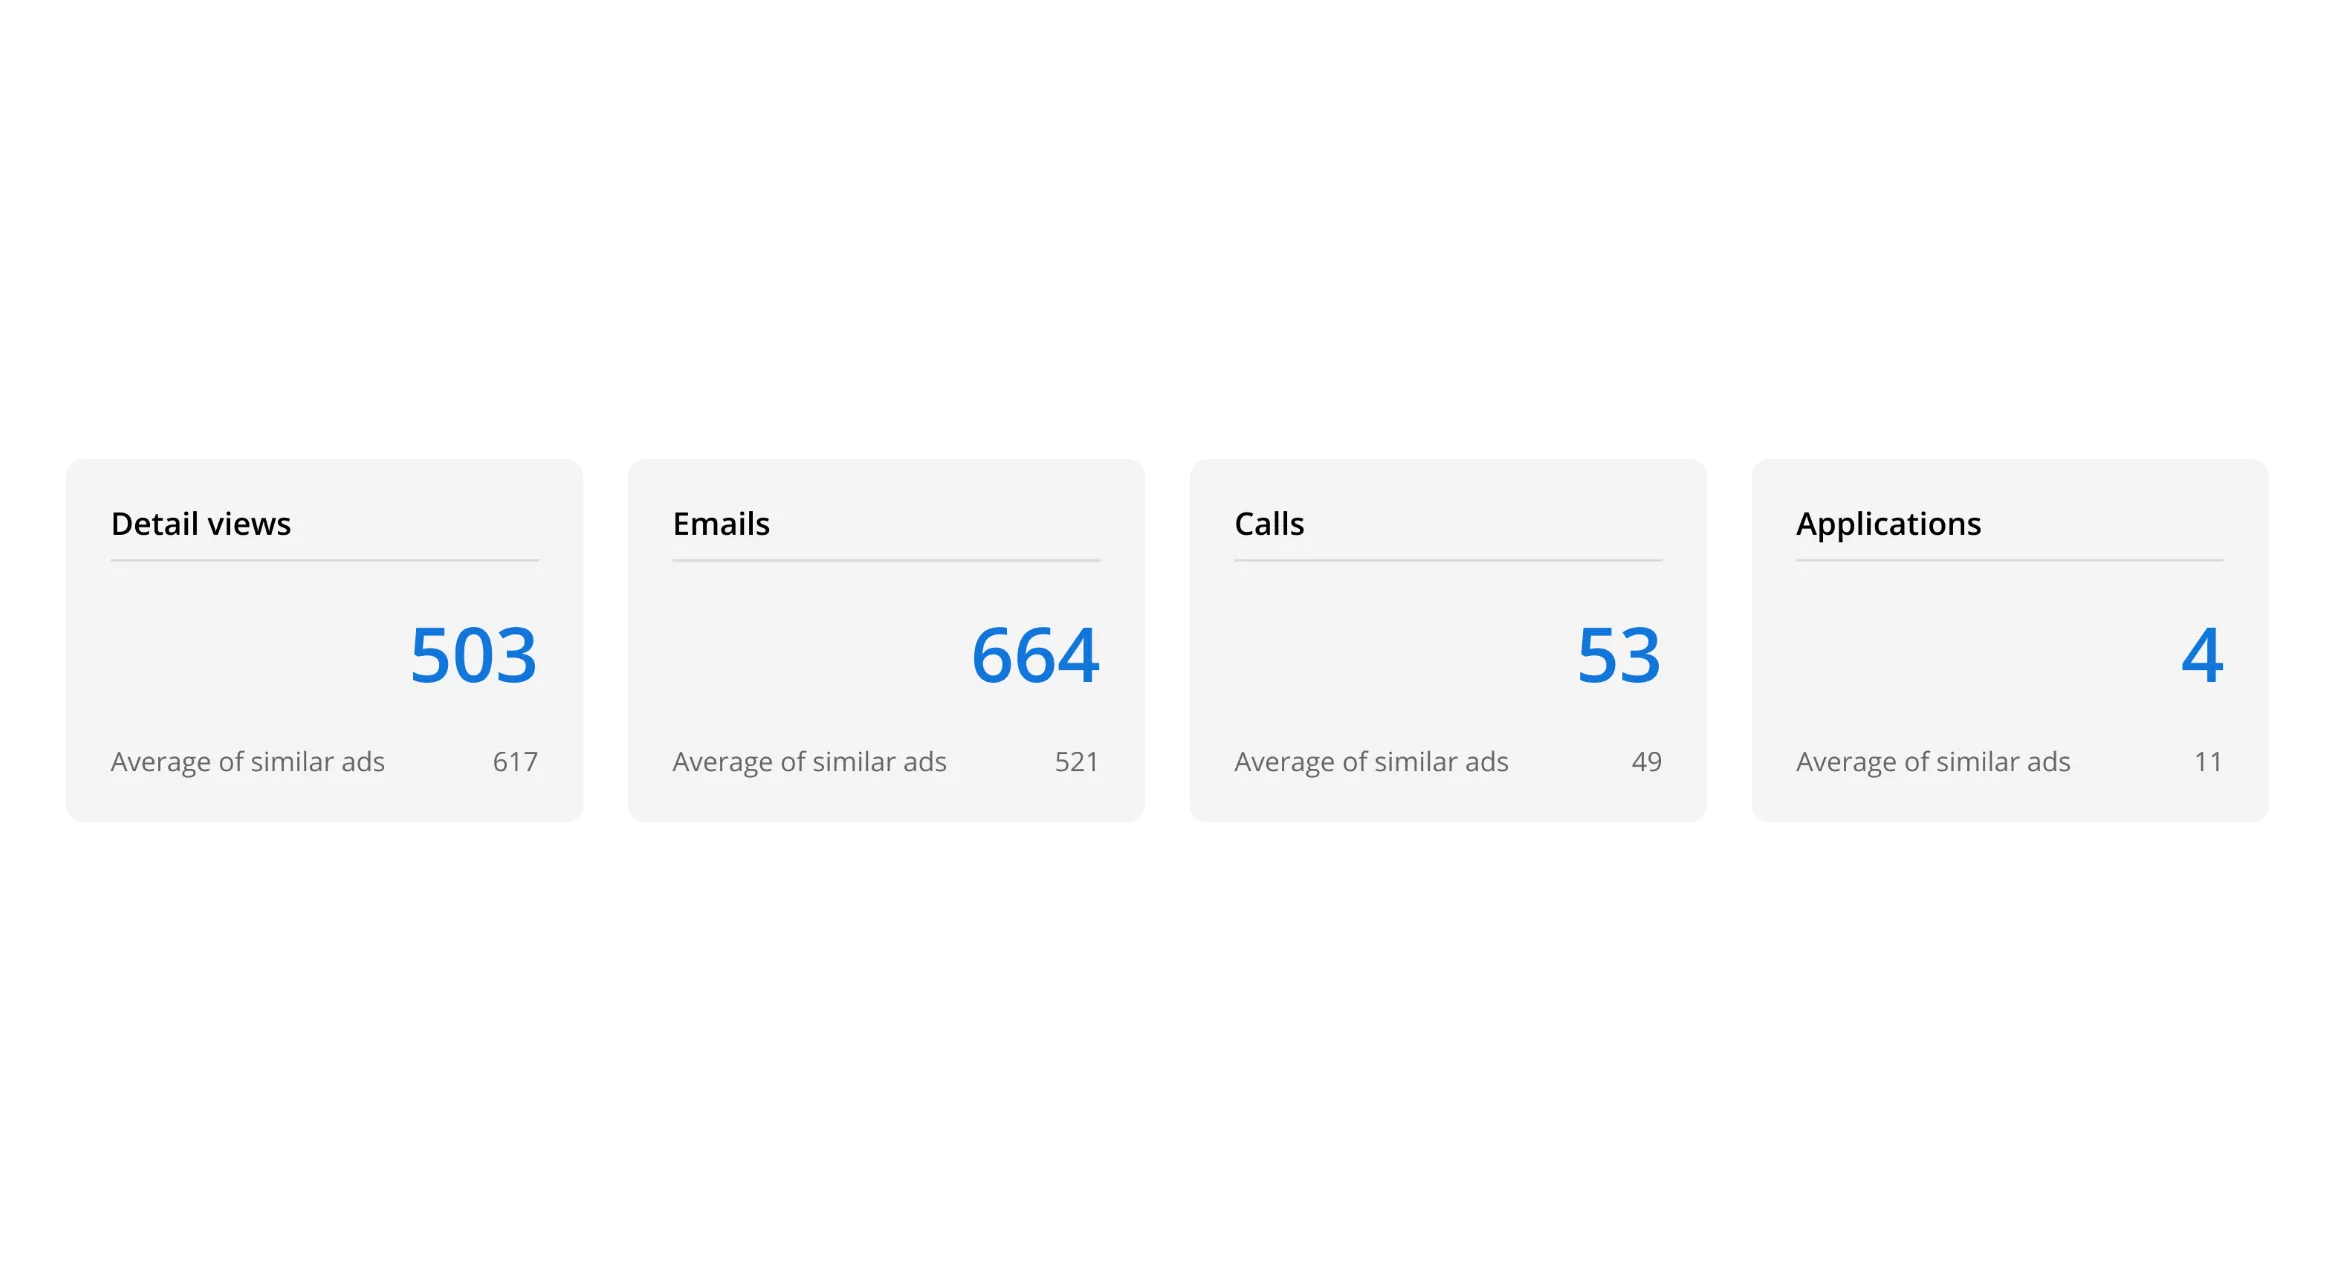
Enlarge image: Four performance overview cards: detail views 503, emails 664, calls 53 and applications 4. Below each number is the average of similar ads, for example 617 detail views and 521 emails.
Overview cards with averages for similar properties.
Enlarge image: The comparison section. On the left, the most recent performance is rated Average, with arrows for below, average and above, compared to 12 similar ads. On the right, a line chart shows the ad rising from below average to above average over the last 7 days. Below both, a yellow banner says the ad could be generating more responses and links to a performance boost.
The comparison section with a 7-day trend.

One click to the details.

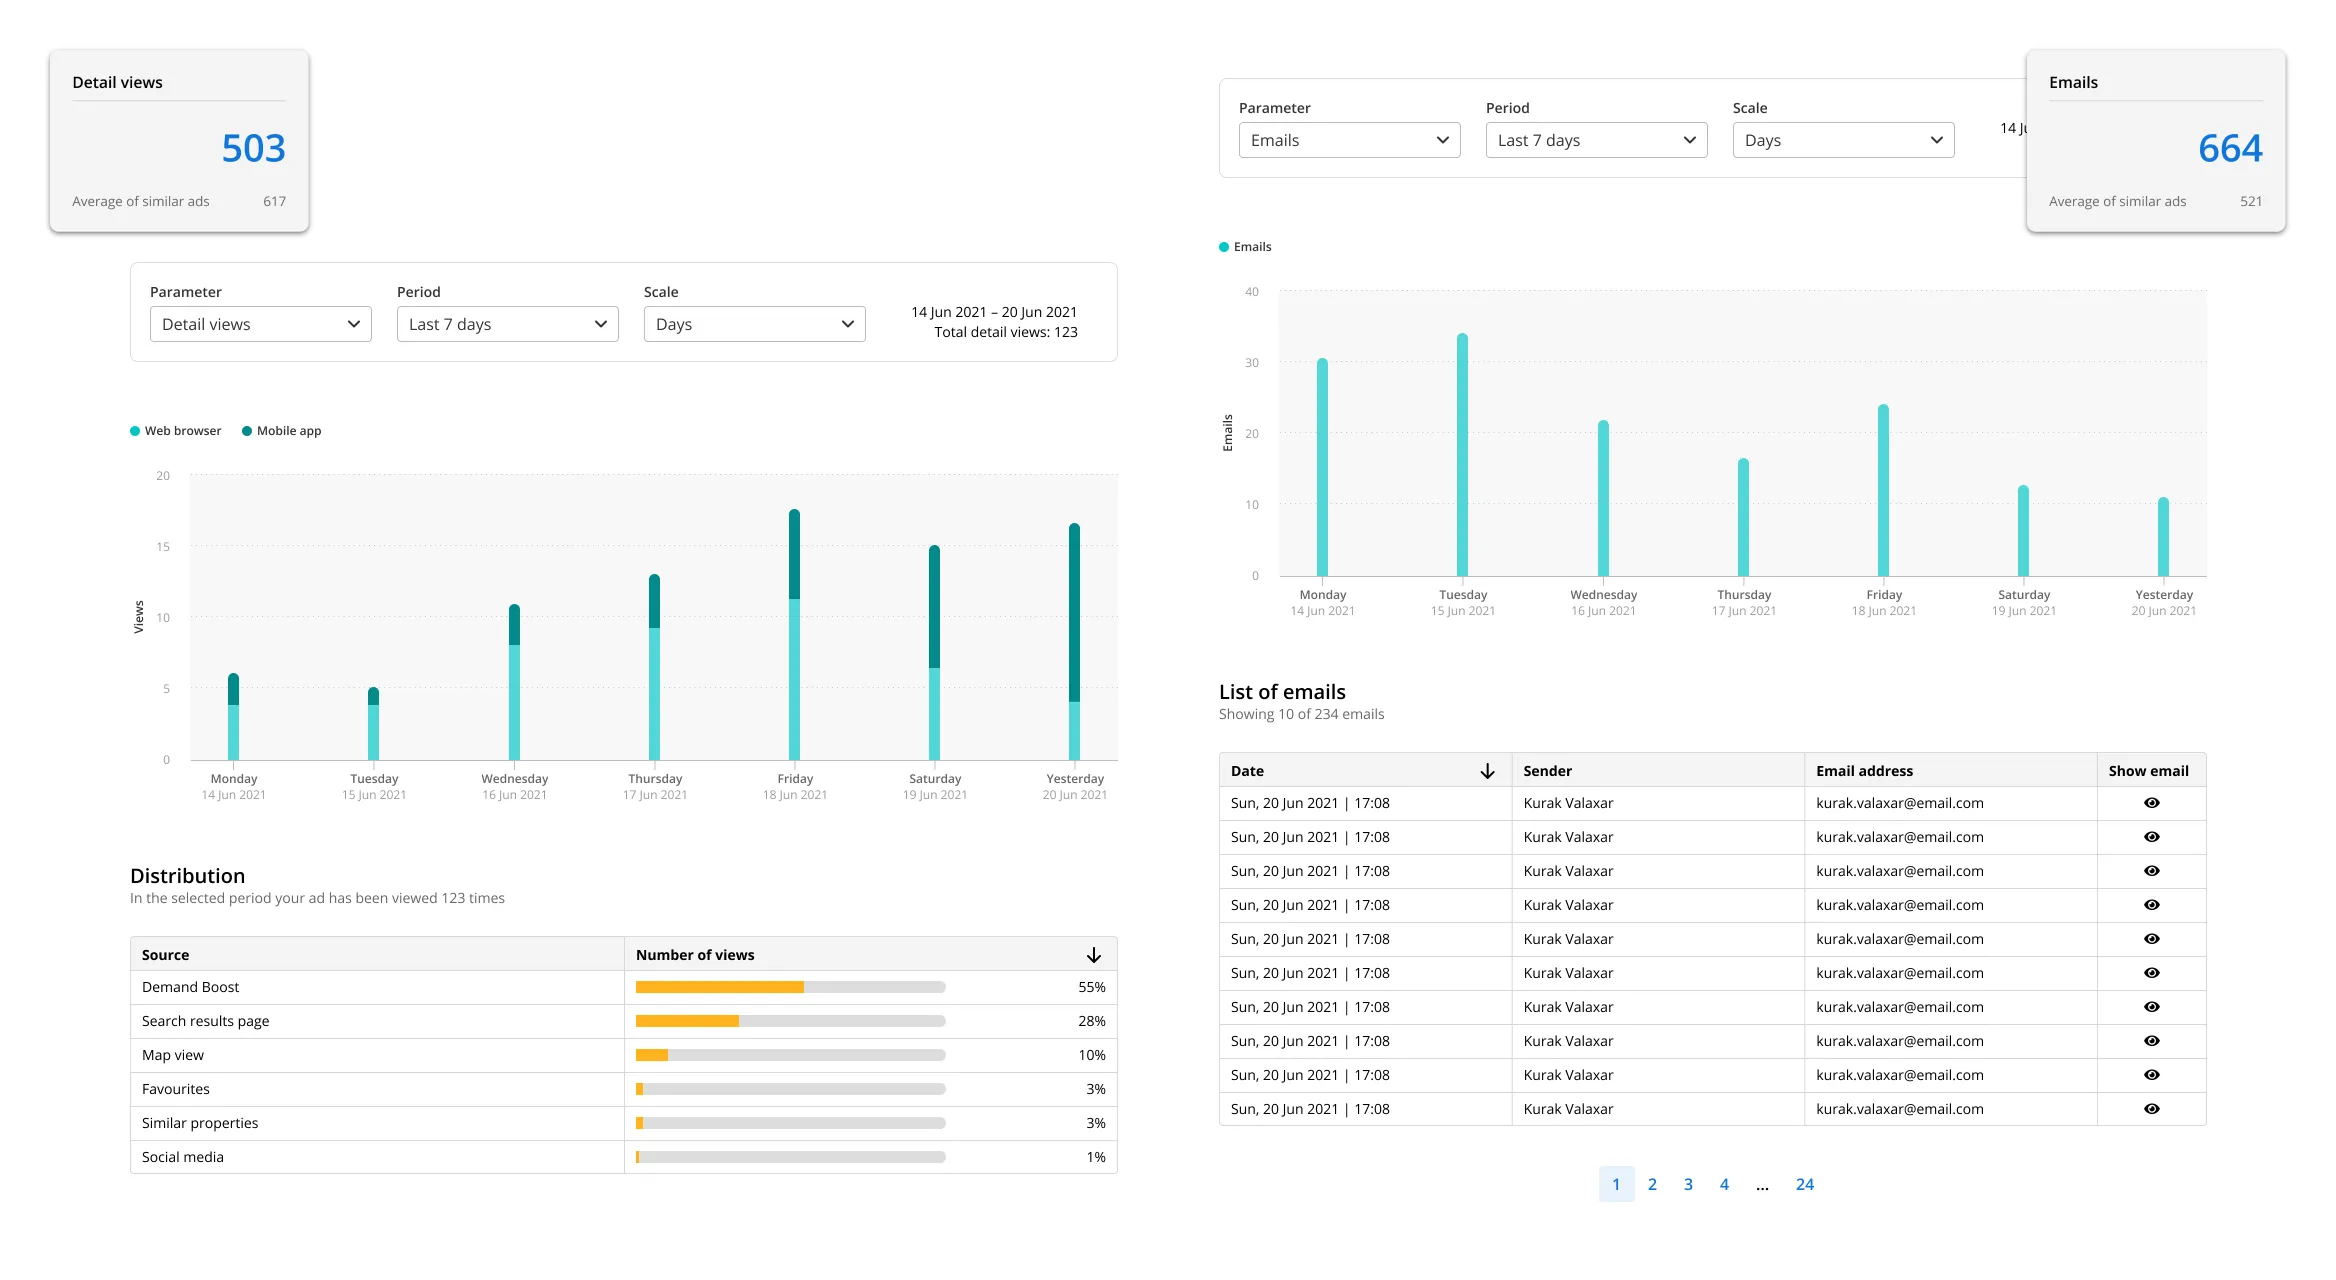
Each overview card is clickable and leads to a new performance detail page with deeper insights into that figure. The overview stays simple, and the detail is there for anyone who wants it.

Enlarge image: Two performance detail pages, each next to the overview card it opens from. The detail views page has filters for parameter, period and scale, a bar chart of the last 7 days split into web browser and mobile app, and a table of where the views came from, led by Demand Boost at 55 percent and the search results page at 28 percent. The emails page has a bar chart of emails per day and a paginated list of emails with date, sender and email address.
Deep-dive performance details.

Before and after.

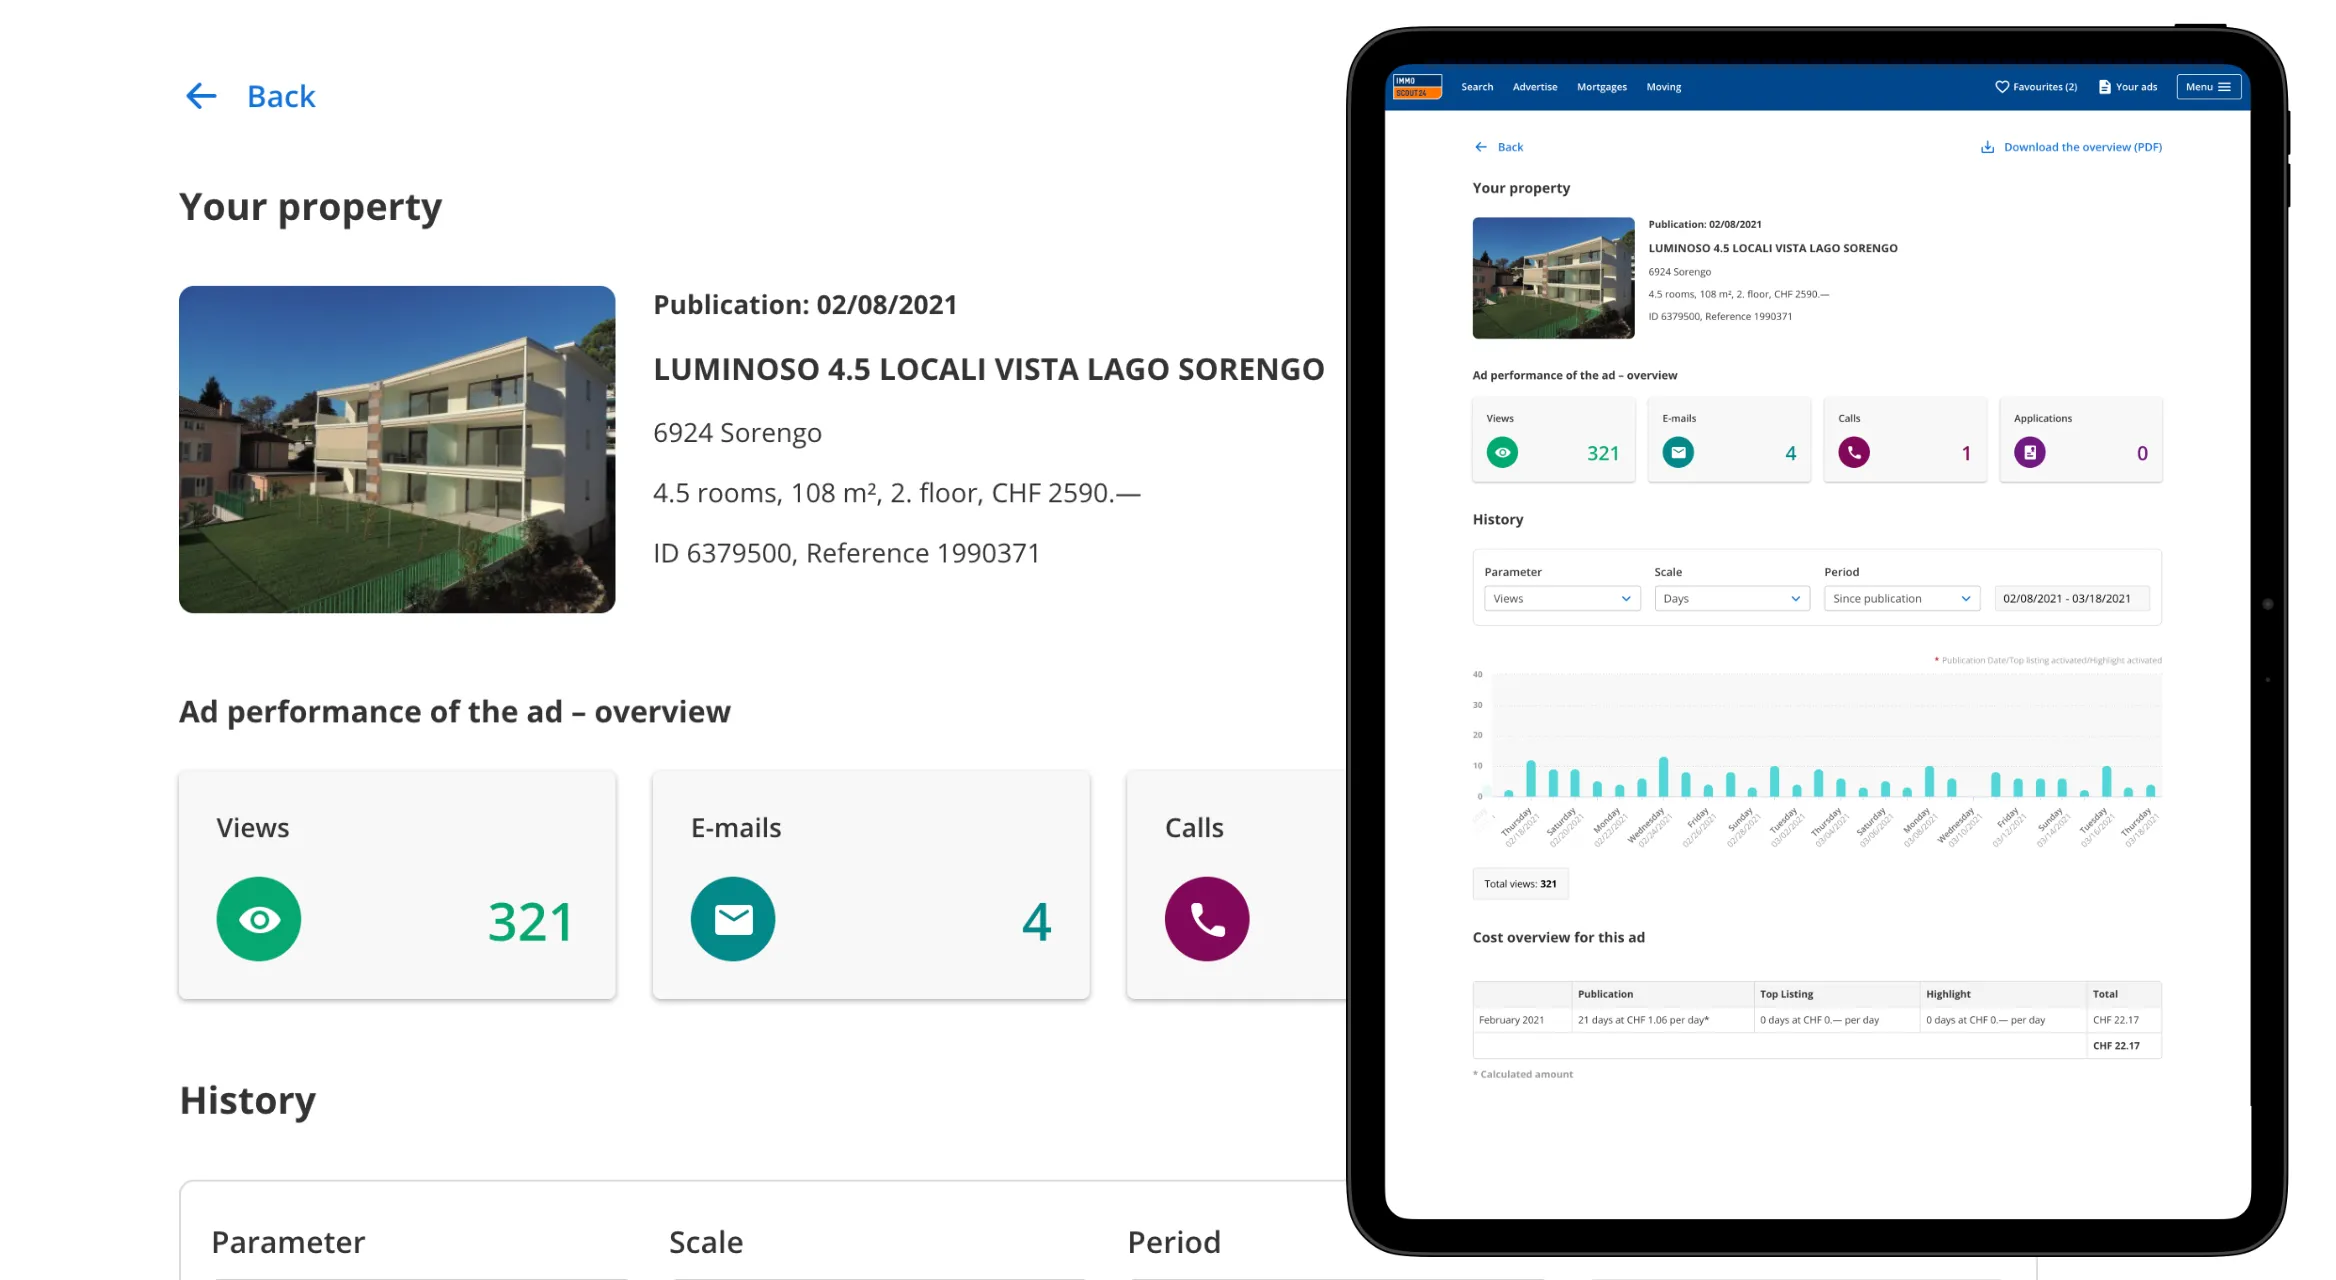
The old page showed totals: views, emails, calls and applications, a history chart and a cost table. Accurate, but with nothing to say whether a number was good or bad, or what to do about it.

The new page reads from top to bottom. The overview puts every figure next to a benchmark, the comparison section gives a verdict and a direction, and touchpoints and shares show how people engage with an ad before they ever get in touch. If a listing falls behind, the page says so and offers a way to boost it.

Result

Performance advertisers can check for themselves.

Advertisers no longer depend on an email or a call to know how a listing is doing. They can look whenever they want, with a benchmark to read the numbers against and a trend that shows whether a change made a difference, whether that was completing a listing or paying for more reach.

Looking back

Closing the loop.

The dashboard became more useful with every feature that came after it. Listing Completeness and Demand Boost both promise better performance, and Ad Statistics is where advertisers can check that promise. Today I’d design the three together from the start, for example by marking on the trend when a listing was edited or a boost was booked. Then advertisers would see cause and effect, instead of having to work it out themselves.

Contact

Let’s make it simple.

Open to freelance projects, full-time roles, and interesting conversations.

Visit me on LinkedIn