From wireframes to prototype.
I started with wireframes to agree on which figures mattered and how they should be grouped, then turned them into a clickable prototype to review with the team before any UI design.
OneLog · 2022
A KPI dashboard for OneLog’s administration tool – and the first step towards an admin interface clients could use on their own.
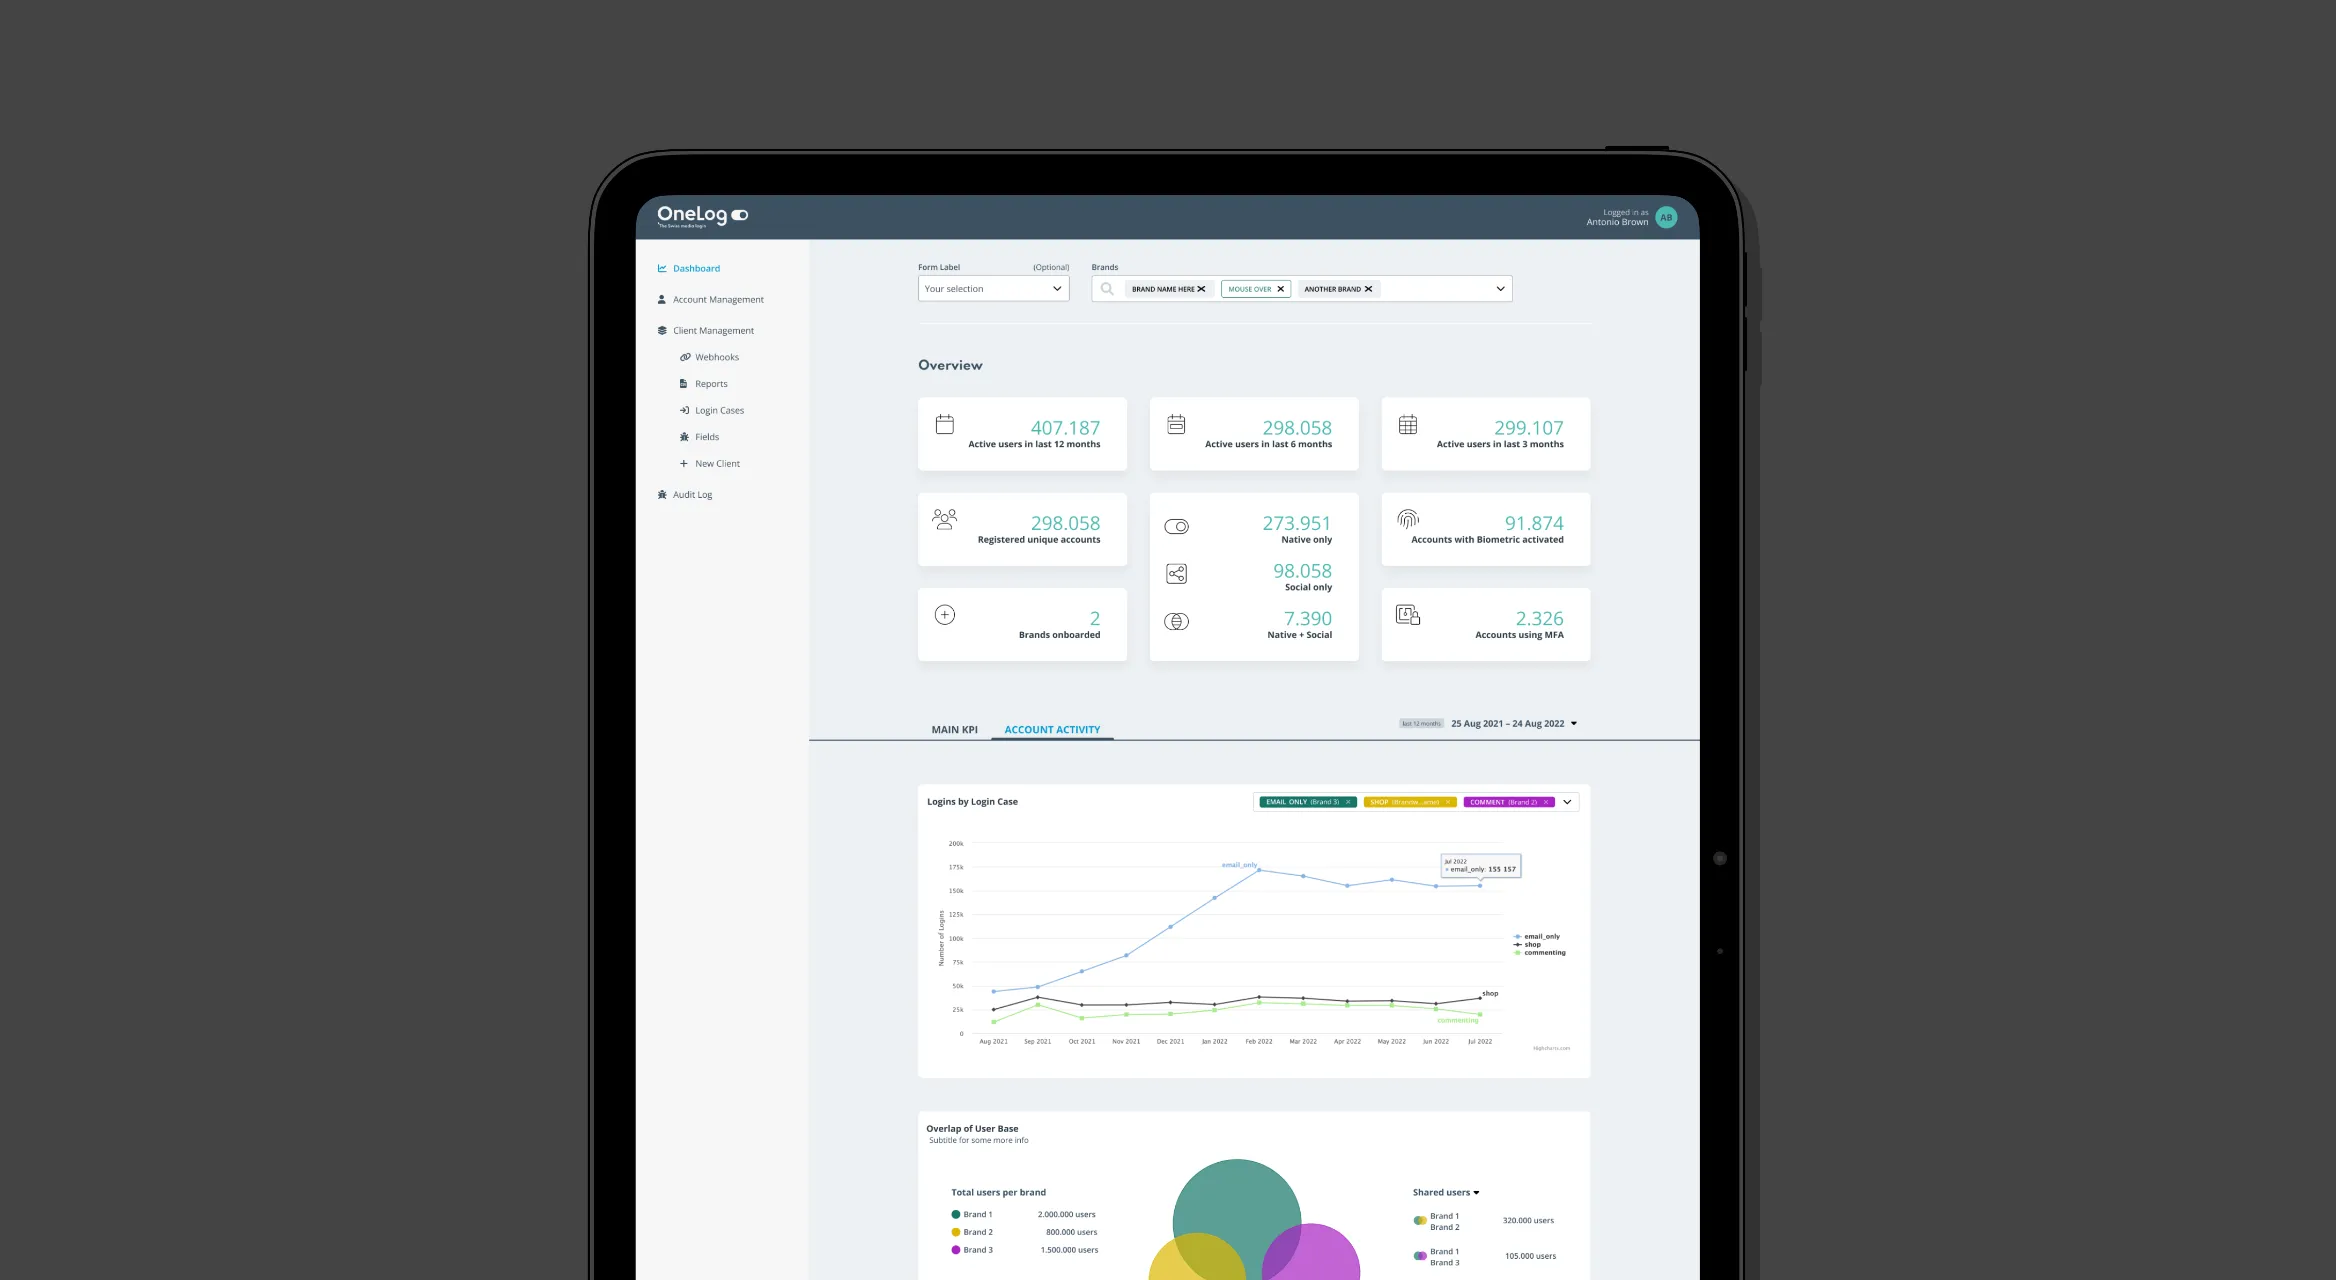
The KPI dashboard was a new feature in OneLog’s administration tool, the internal back office for managing the service and reporting on it. Until then, the admin interface had mostly been designed by the developers who built and used it.
I designed the new dashboard and used it to set a direction for the rest of the tool: a calmer, more modern look in the brand colours, a sidebar navigation and a clearer structure.
The challenge
The admin tool did its job, but it had grown screen by screen without a designer, and it showed. There was no shared structure or navigation, and the look had little to do with the OneLog brand. A new reporting feature was the chance to start changing that without redesigning everything at once.
Approach
I started with wireframes to agree on which figures mattered and how they should be grouped, then turned them into a clickable prototype to review with the team before any UI design.
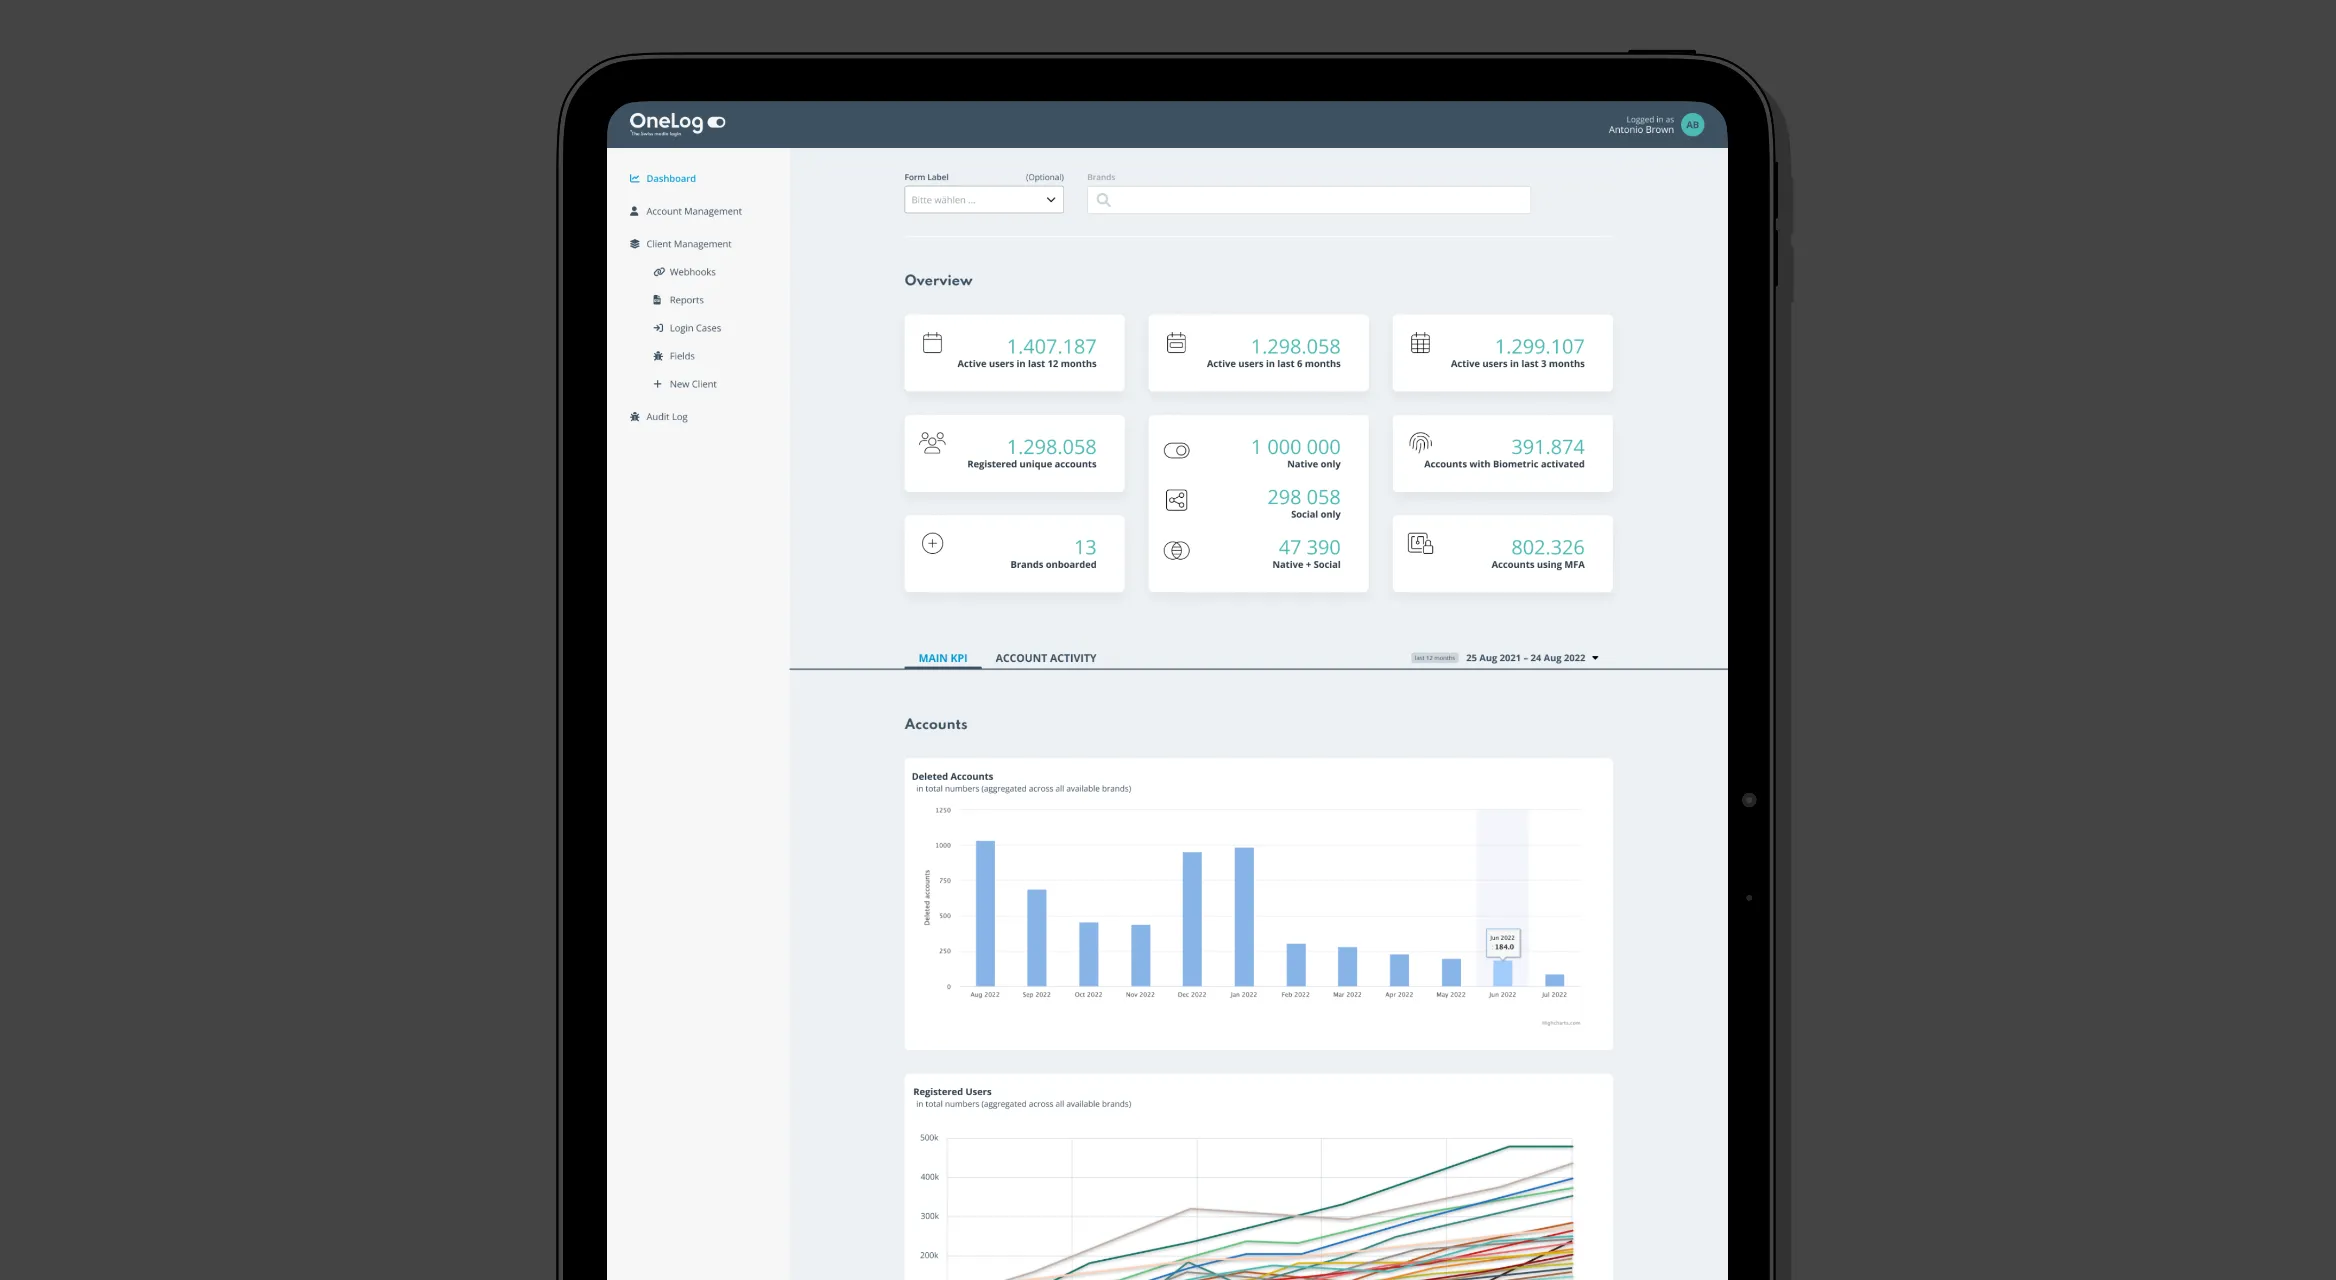
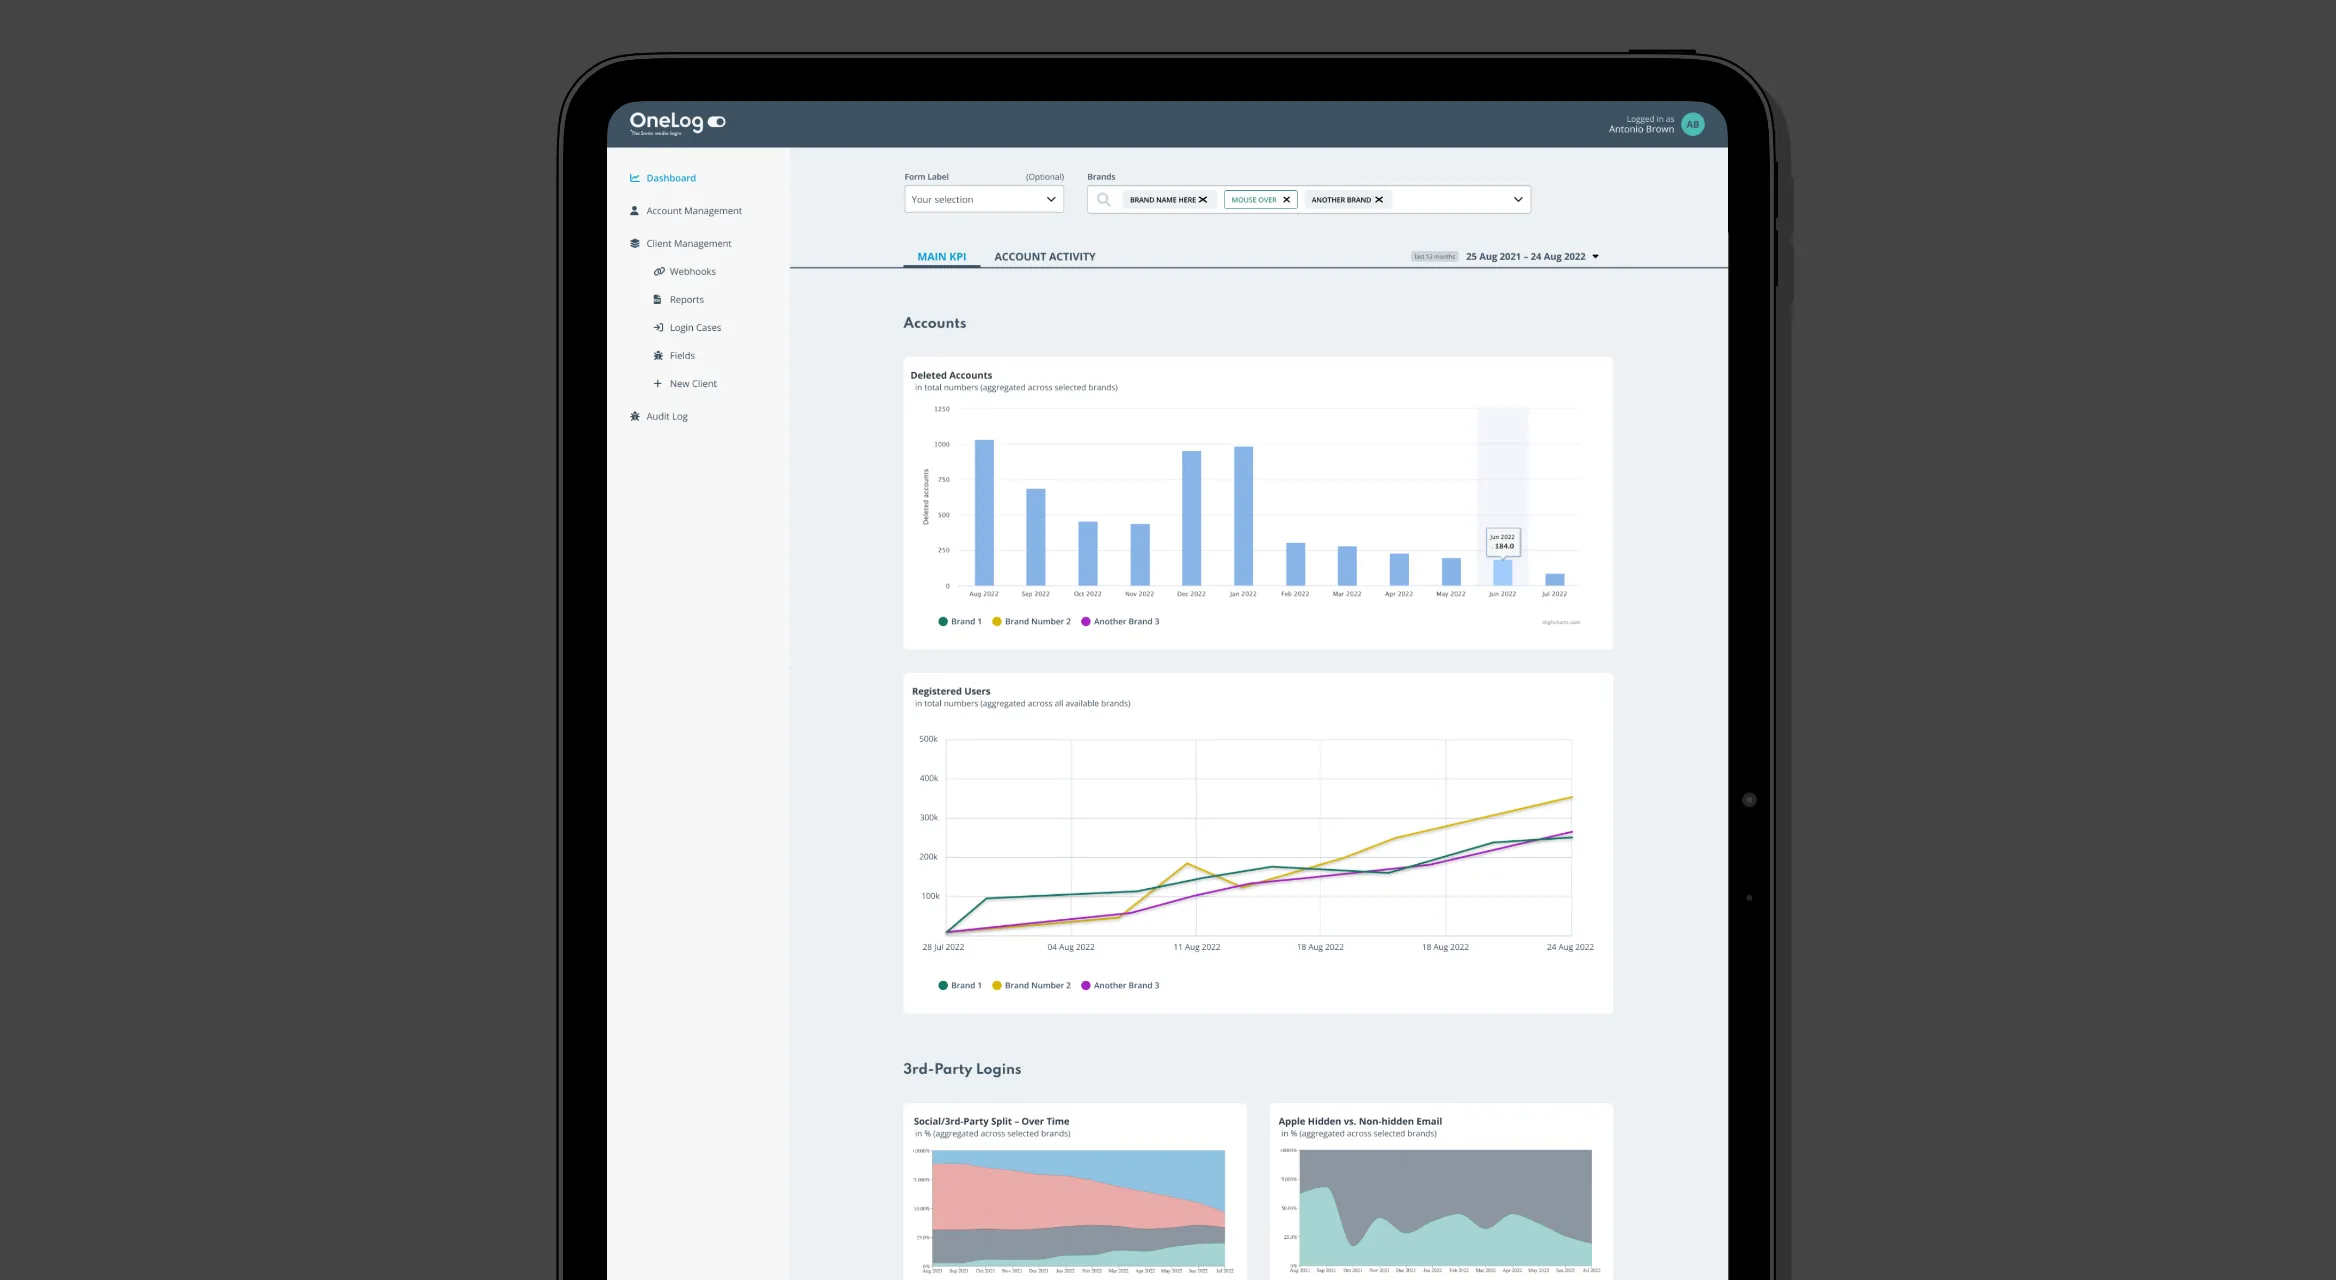
The dashboard shows the key figures for all clients at once, or for just the ones you pick. The layout stays the same either way, so the numbers are easy to compare. A new collapsible sidebar navigation replaced the old static menu and gave the rest of the tool a structure to grow into.
Result
The new section was easier to use and more consistent, and it gave the admin interface a design language to build on. It was also the first step towards letting clients find their own figures, without having to ask us for them.
Looking back
Since none of our clients had used the admin tool before, it was hard to know which figures mattered most to them – and they didn’t seem to know either. We designed the dashboard around our own assumptions, and only learned later which figures people actually looked at. That varied quite a bit from client to client. Today I’d make the dashboard configurable, so each client can choose the figures they want to see.
Contact
Open to freelance projects, full-time roles, and interesting conversations.
hello@christianheynert.comVisit me on LinkedIn