All work

5 min read

TVSquared · 2017

TV ad data, readable by non-analysts.

The redesign of TVSquared ADvantage, the platform advertisers bought to see what their TV and streaming ads actually achieve – and the start of design as a process at the company.

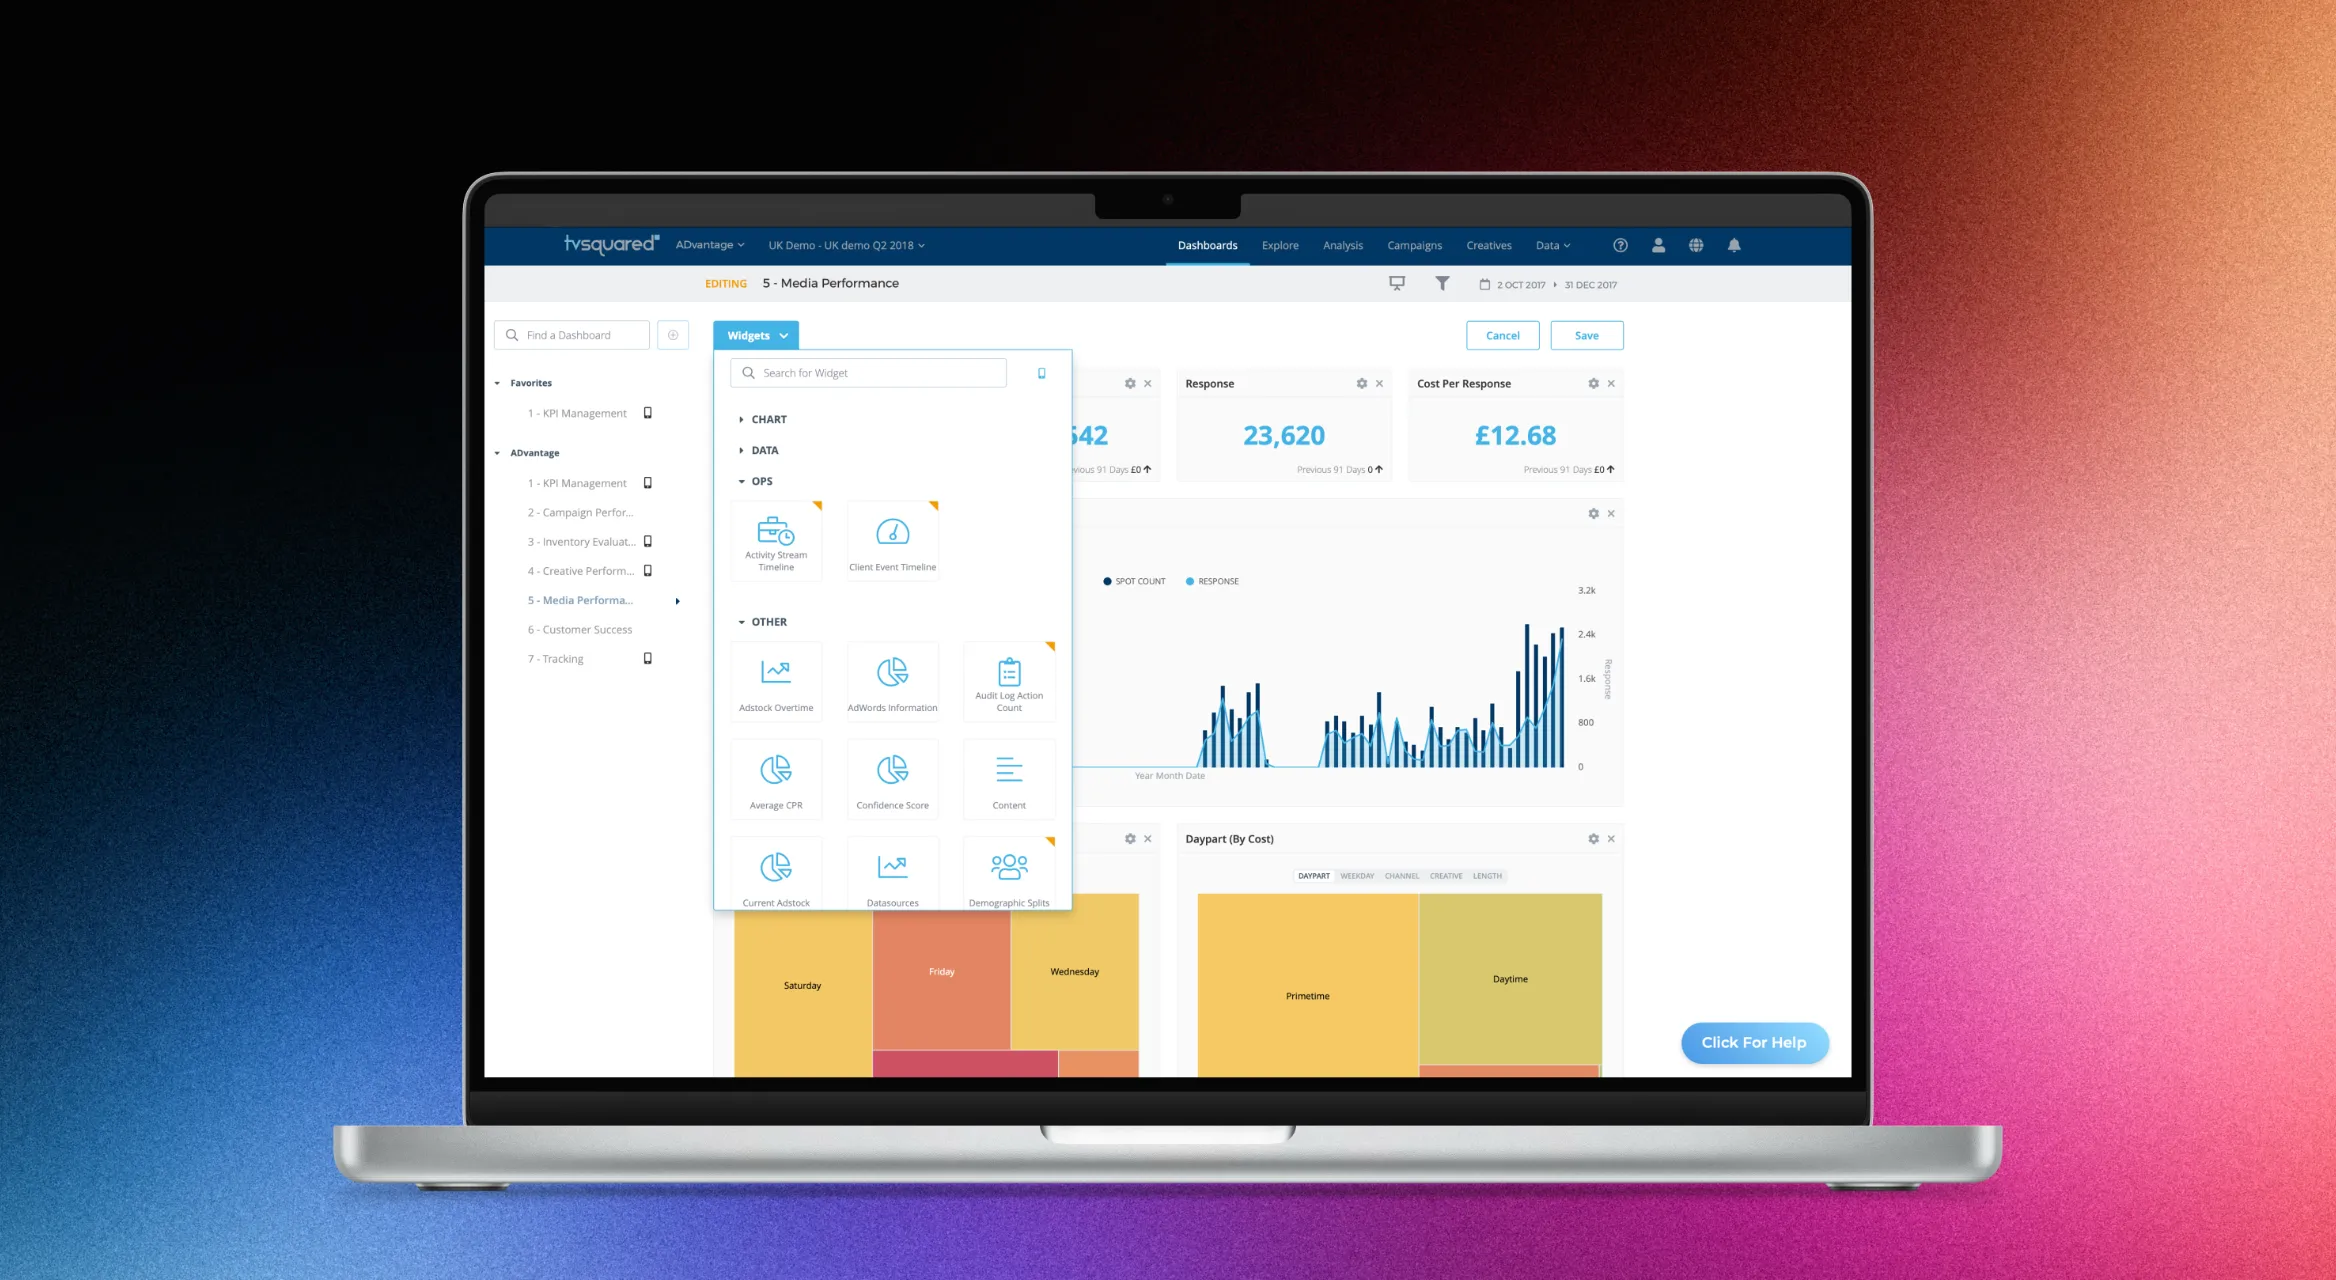
Enlarge image: A laptop showing an ADvantage dashboard in edit mode: the widget library is open over the dashboard, with widgets grouped into Chart, Data, Ops and Other, next to key figures, a bar chart and daypart heatmaps.
Editing a dashboard – widgets come from a searchable library.

At a glance

I joined TVSquared as its first designer. ADvantage was the main product: advertisers bought it to see how their TV and OTT campaigns performed. I redesigned it end to end, introduced the design system behind it, and set up how design worked with product managers, developers, and even the CEO.

Client
TVSquared
Industry
TV and streaming ad analytics
My role
UI/UX Designer, first designer on the team
Duration
2017
Platform
Web (SaaS)
Tools
Adobe XD, zeroheight, Zeplin, GitHub
Deliverables
Platform redesign, dashboards, design system, design process

The challenge

Design was decided in meetings.

TVSquared’s analysts and data scientists built the models behind the platform – measured, probabilistic and predictive data about how TV ads drove conversions. Most of the people buying ADvantage weren’t analysts. They needed to read those numbers without a PhD.

Before I joined, design was done by committee: developers made UI decisions as they went, and feature ideas went straight to Product. Engineering was glad to finally have a designer, but the process had to be built first. The CEO was closely involved and keen to see new features ship quickly – part of my job was giving that energy a route through design.
Approach

Understand first. Then build the process.

Salesperson, data scientist, customer.

I sat in on sales calls and also talked to customers directly. Just as much time went into the data scientists – learning what their numbers meant until I could explain them back – and matching that understanding to what customers actually needed to see.

Redesigning the core screens.

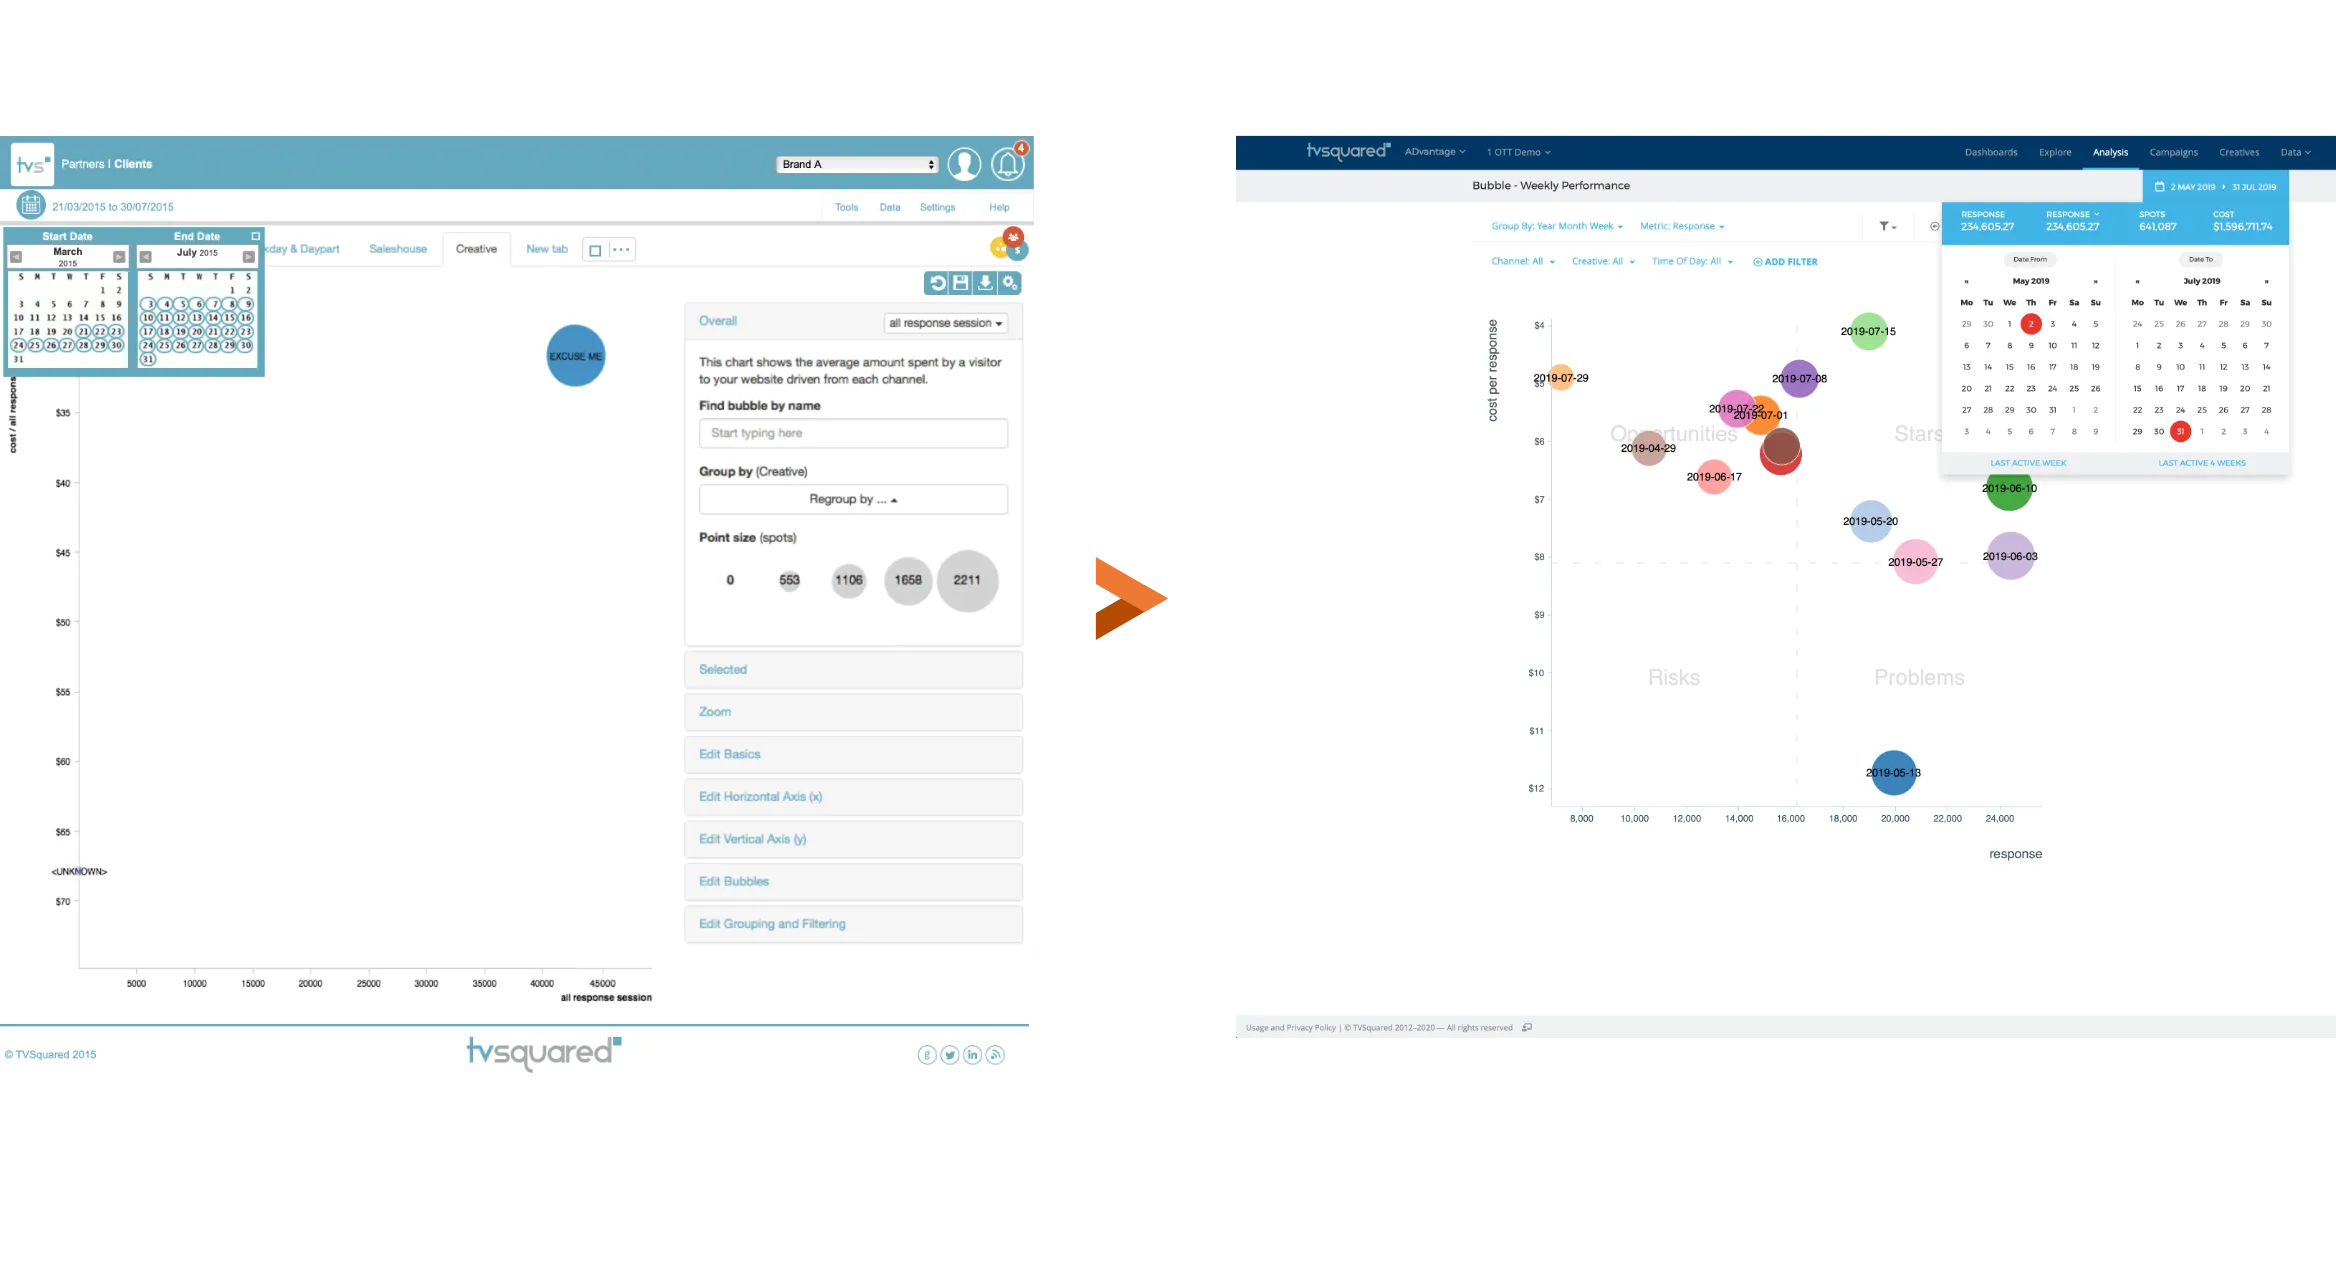
The analysis screens held the most data and gave the least guidance. I rebuilt them around the questions customers actually asked: what’s working, what isn’t, and what should change.

Enlarge image: Two versions of the bubble chart in ADvantage’s Analysis section. Left, the 2015 screen: a nearly empty chart with a single bubble, an open date picker covering the axis, and a long settings panel of collapsed sections. Right, the redesign: a weekly performance chart with coloured bubbles spread over four labelled quadrants – Opportunities, Stars, Risks and Problems – with filters above it and the key figures in a bar at the top.
Analysis – from an empty chart and a wall of settings to four quadrants that say what to do.
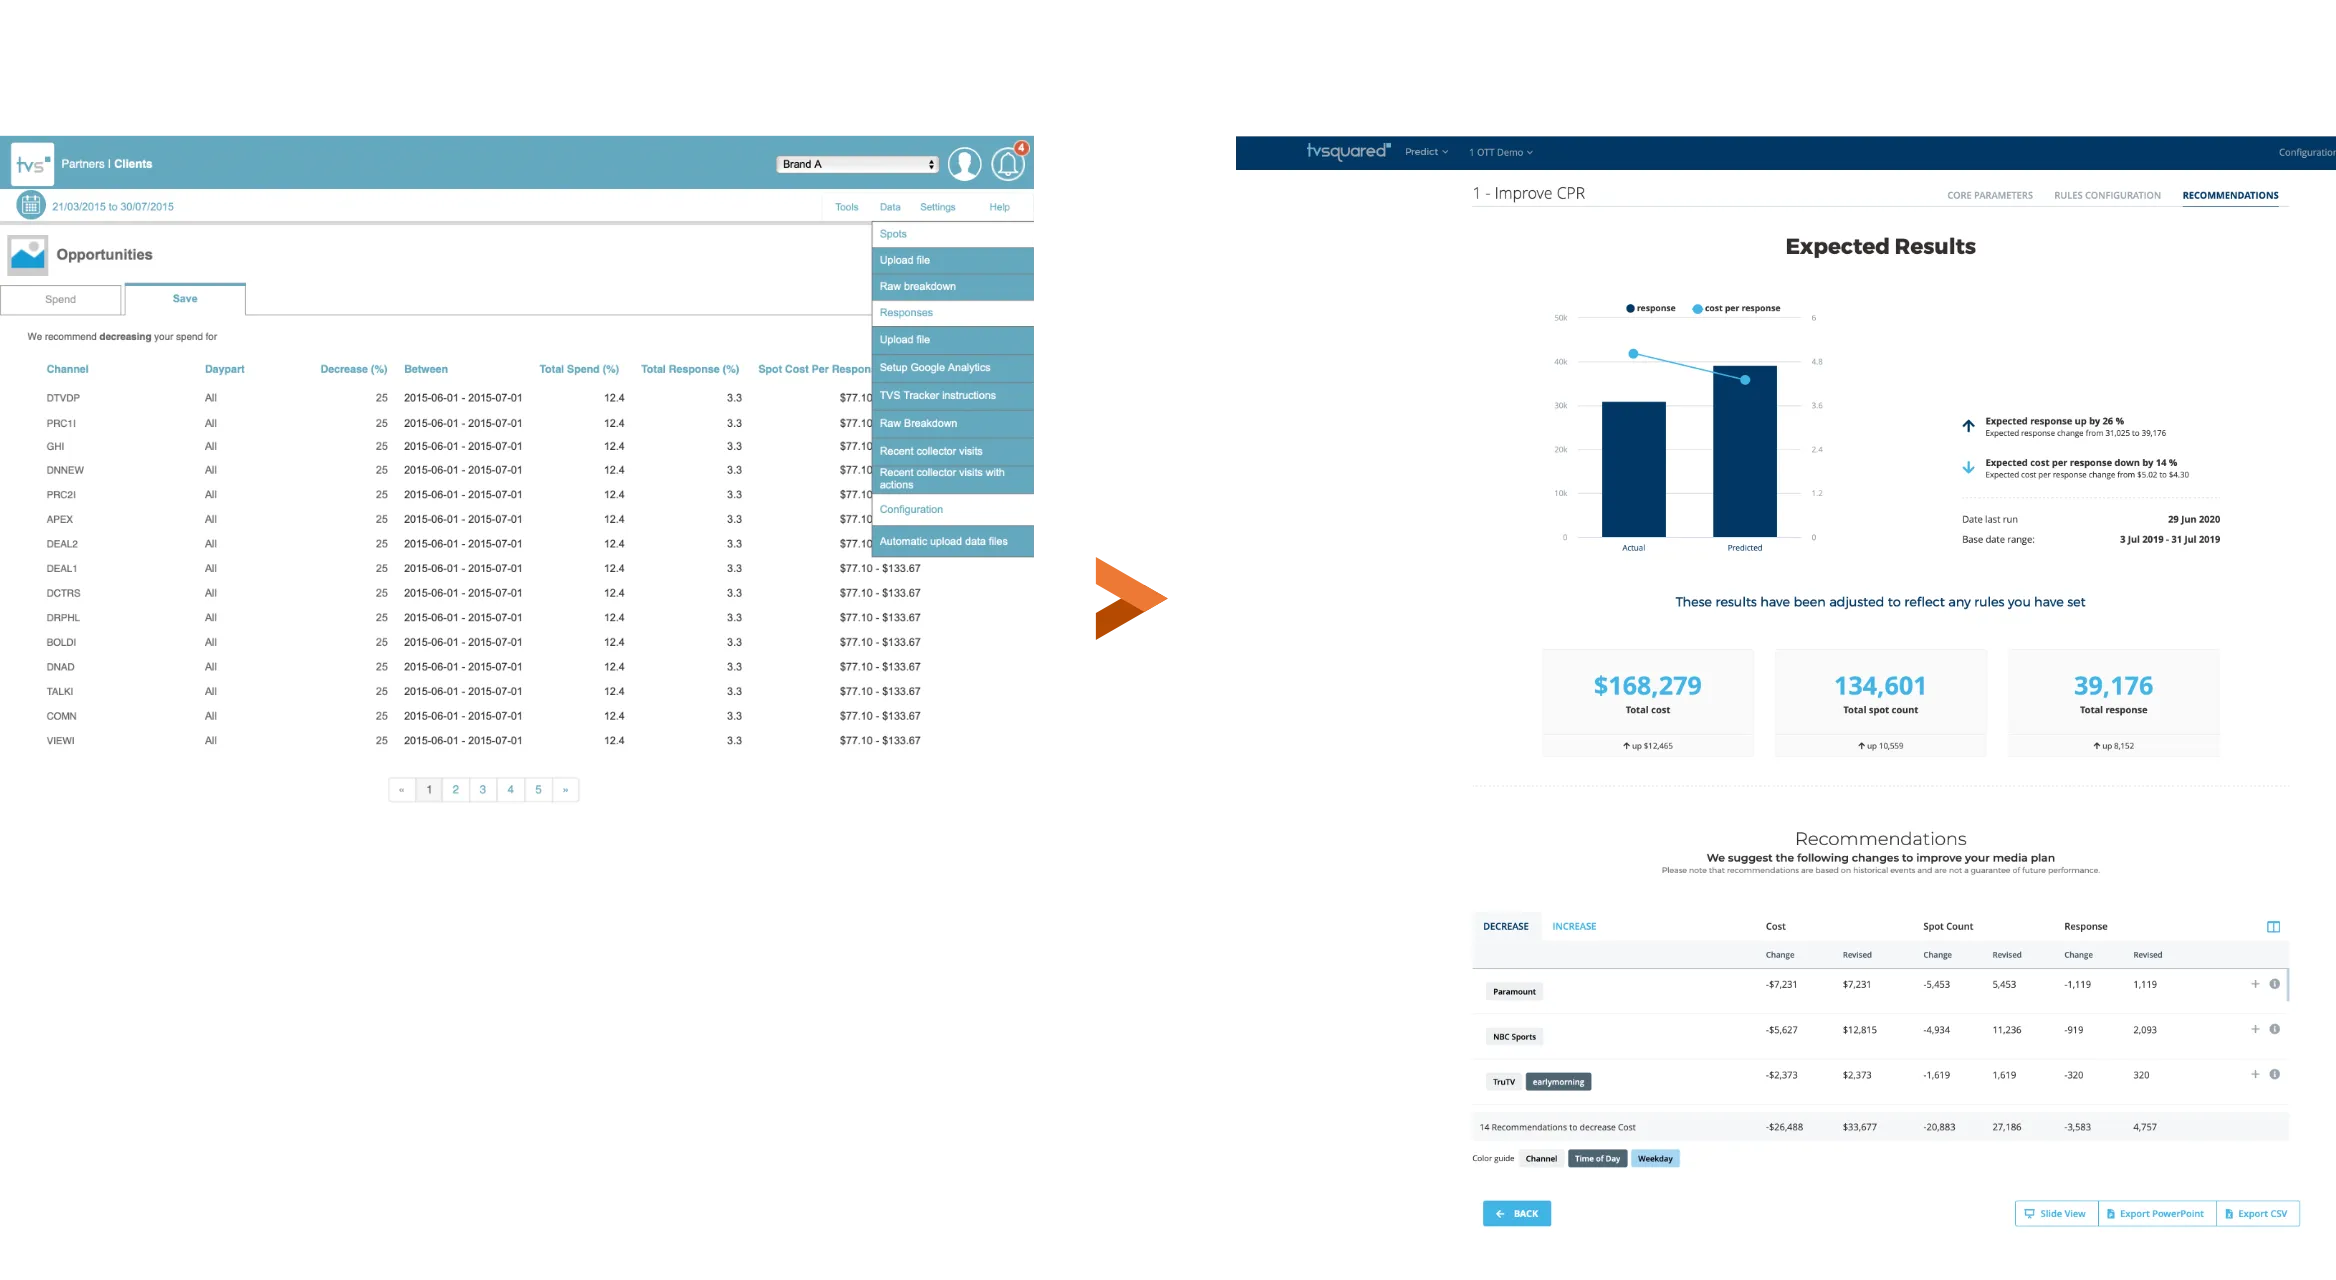
Enlarge image: Two versions of TVSquared’s recommendations. Left, the old Opportunities page: a paginated table of channels, each with the same decrease percentage, date range and cost range. Right, the redesign: Expected Results, with a chart of actual against predicted response, three large summary figures, and a short list of recommended changes per network.
Recommendations – from a table of identical rows to expected results and a few clear changes.

The first dashboards.

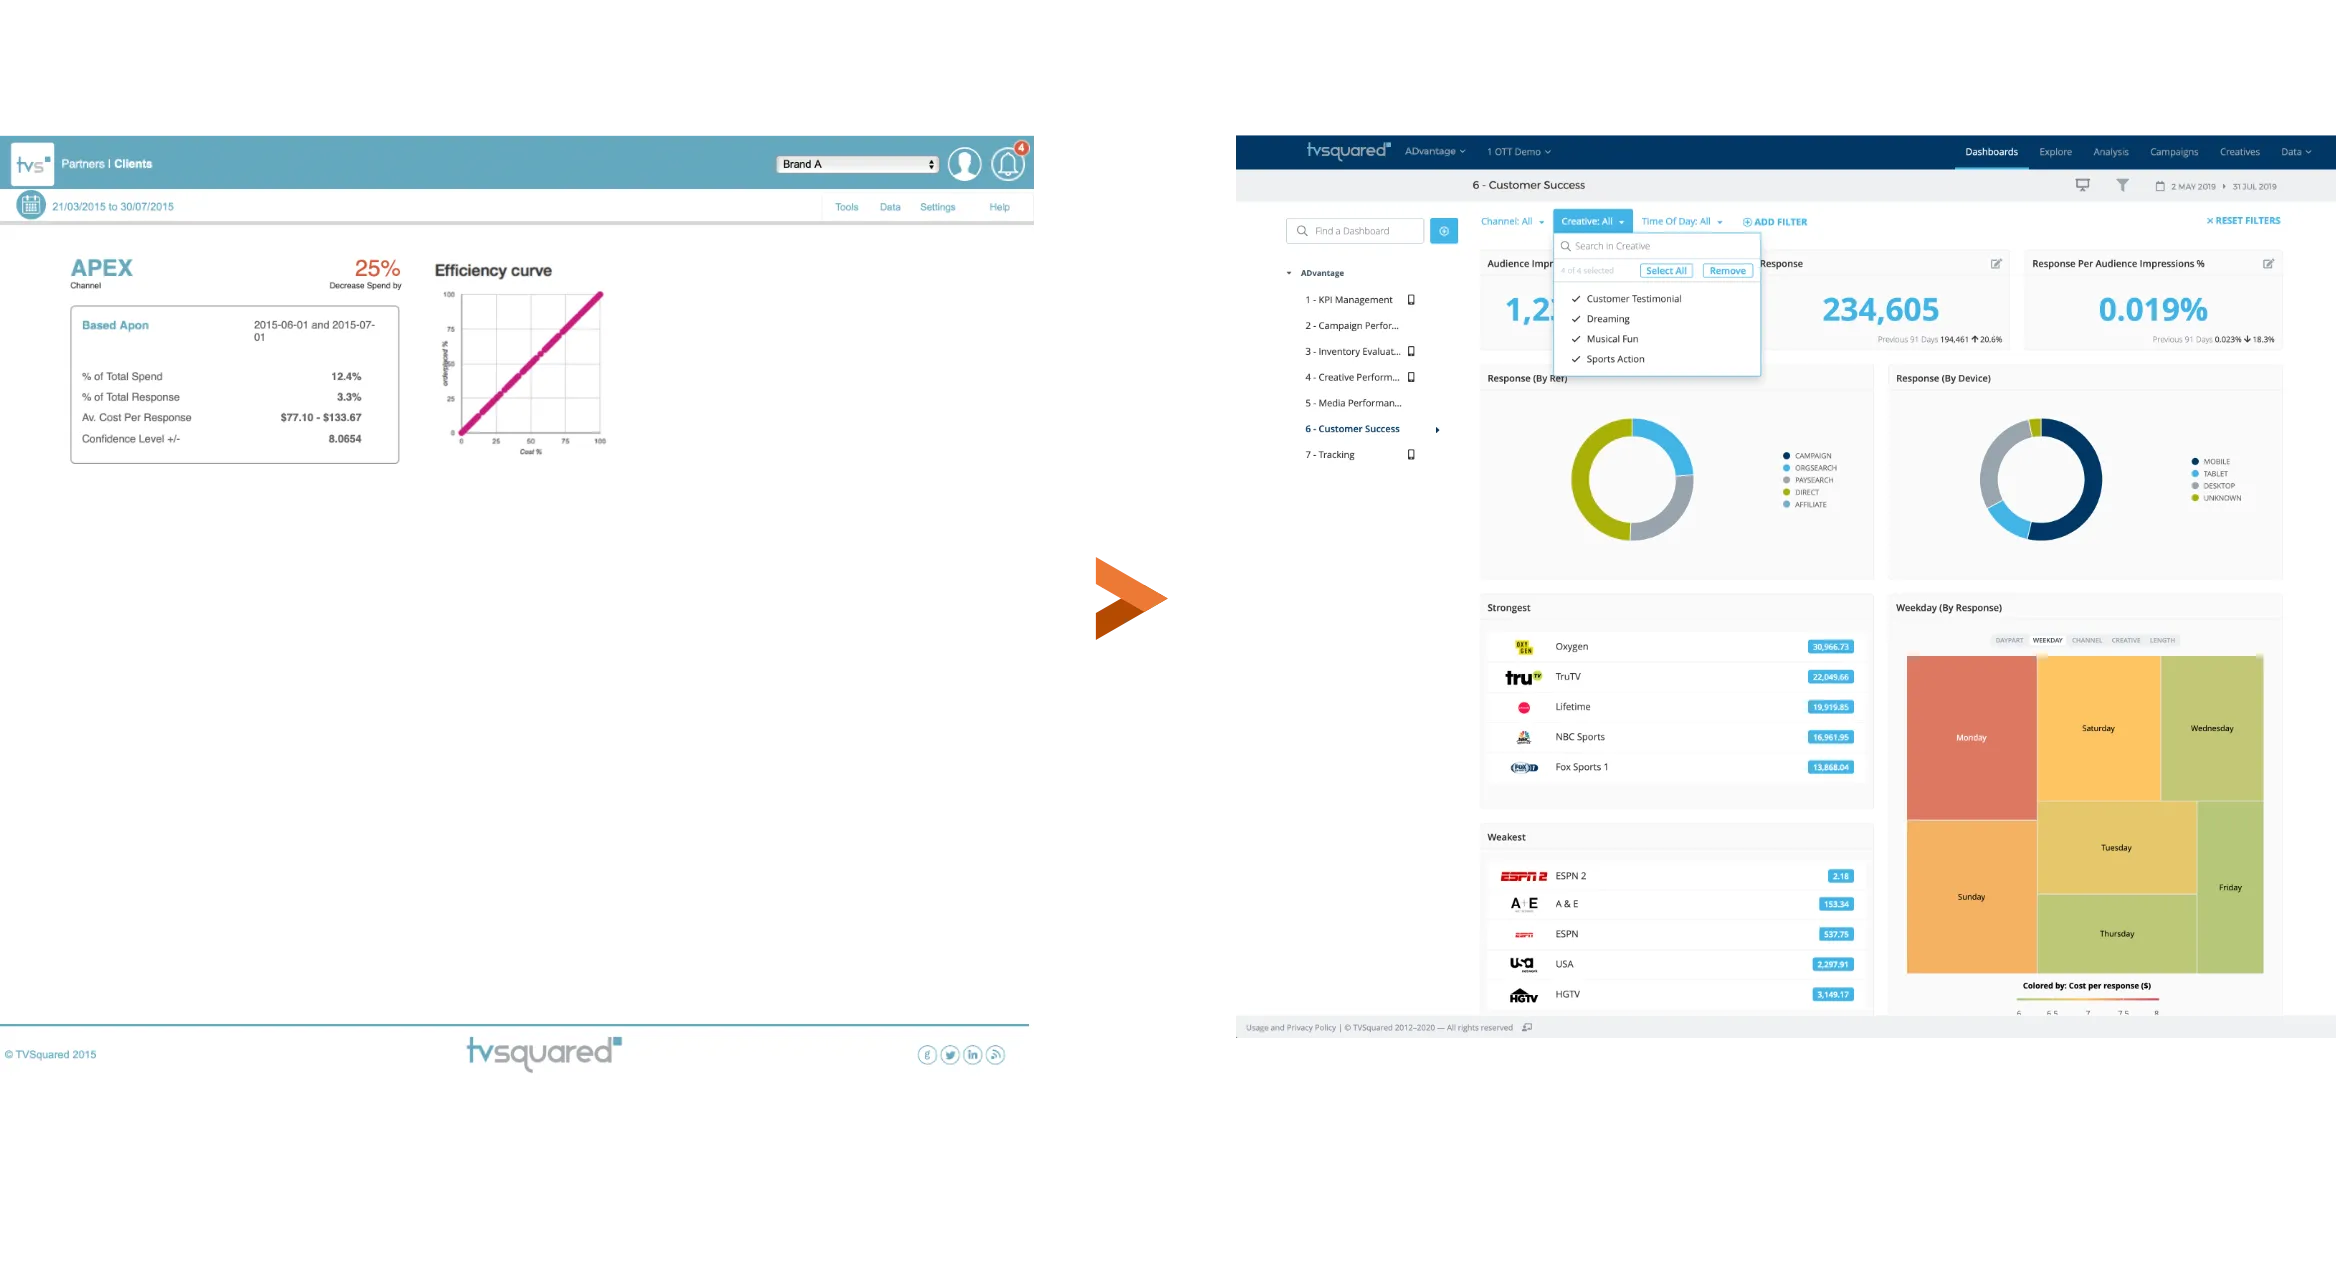
There were no proper dashboards before. I designed the first ones: users could create several, build them from a library of widgets, customise them, and keep them private or share them with their team.

Enlarge image: Left, the closest thing to an overview in 2015: a detail page for one channel with a few figures and an efficiency curve. Right, a Customer Success dashboard from the redesign: a list of saved dashboards on the left, filters at the top, and widgets with key figures, donut charts, the strongest and weakest networks, and a heatmap of response by weekday.
From one channel at a time to dashboards built from widgets.
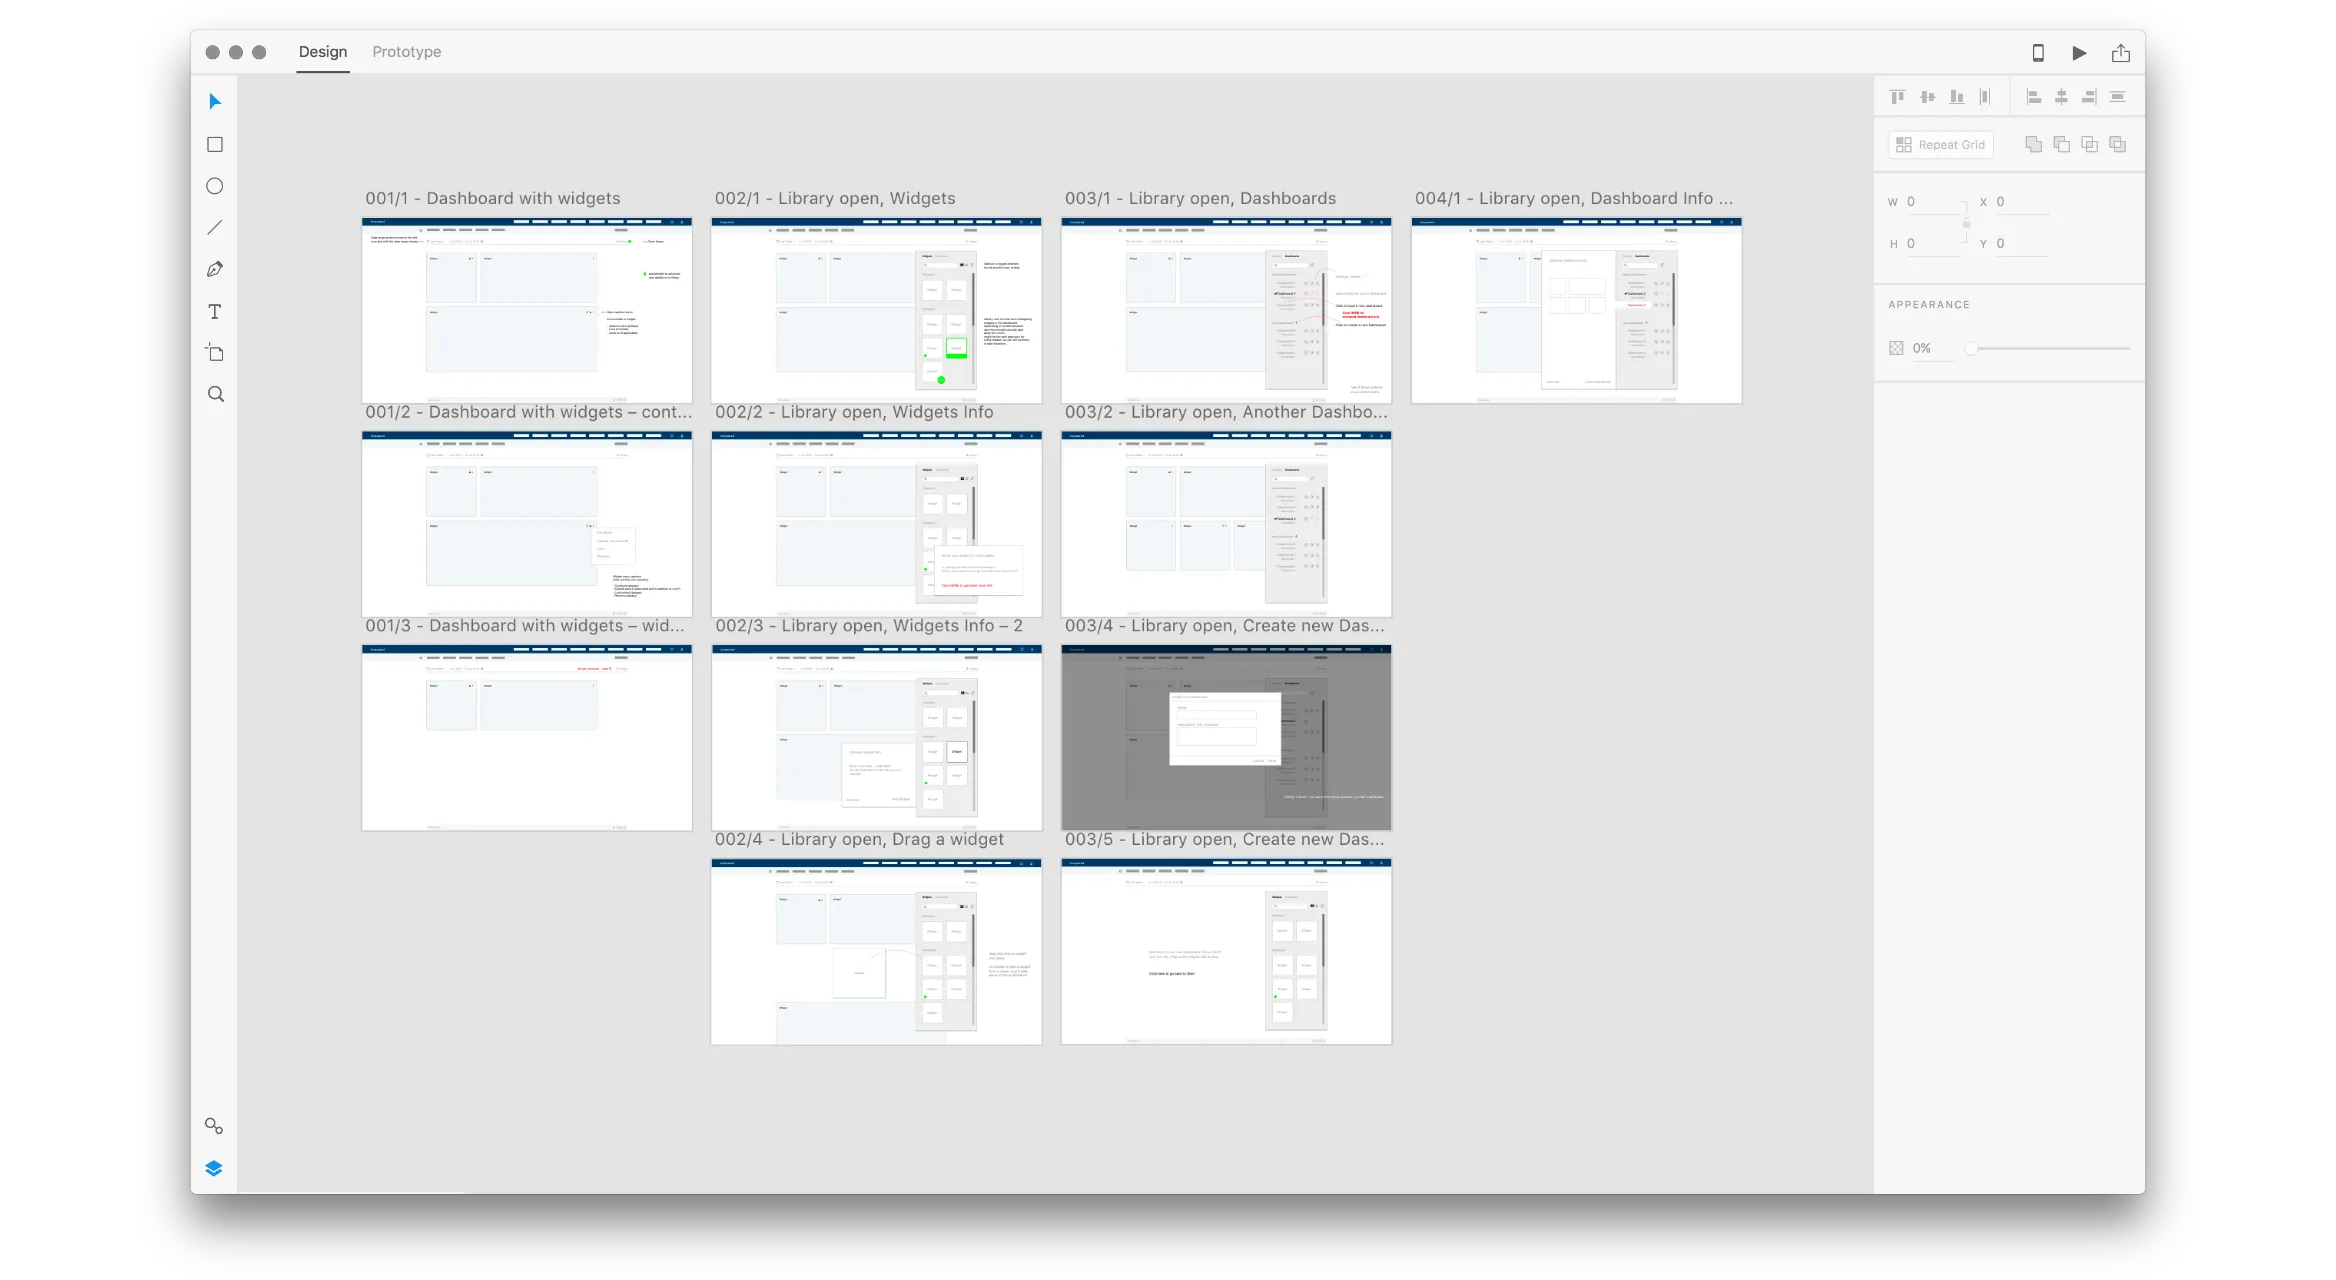
Enlarge image: An Adobe XD file with grey wireframes of the dashboard editor, in three columns: a dashboard with widgets, the widget library open beside it, and the dashboard library for creating and switching dashboards.
The wireframes in XD – adding widgets, and creating and sharing dashboards.

Settings you can scan.

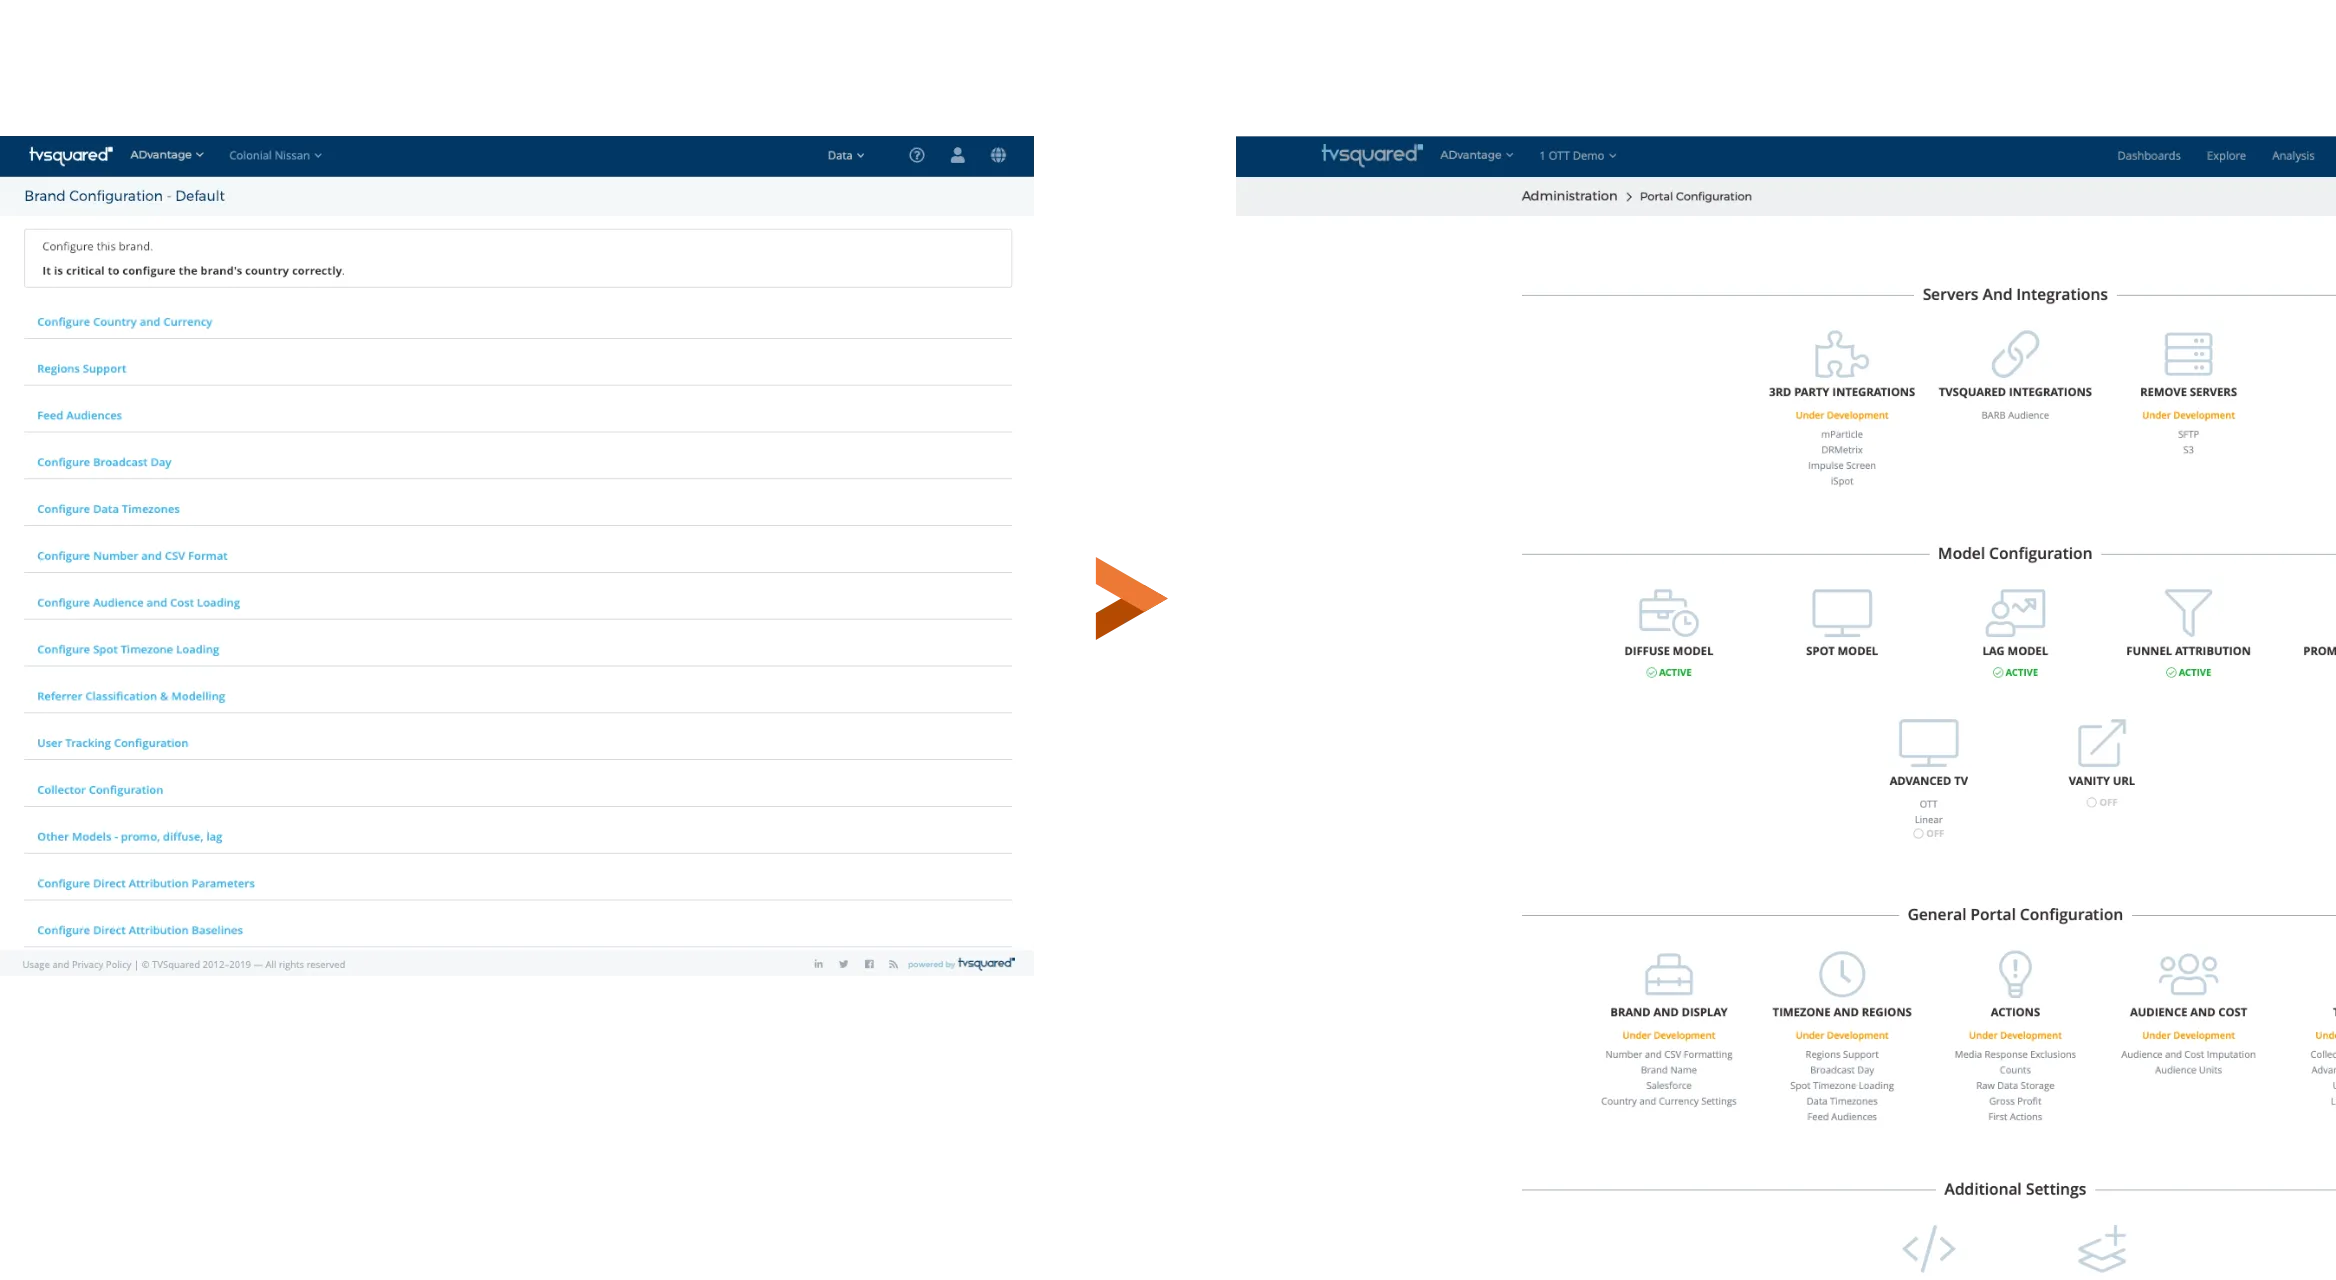
Every client brand had to be configured before its data made sense – country and currency, timezones, audiences, models, integrations. In the admin area that was one long list of links. I grouped the settings into clear sections and showed the state of each one at a glance: active, off, or still in development.

Enlarge image: Two versions of TVSquared’s brand configuration. Left, the old page: a long single column of blue text links such as Configure Country and Currency and Configure Broadcast Day. Right, the redesign: settings as icon tiles grouped under Servers and Integrations, Model Configuration and General Portal Configuration, each with a status such as Active, Off or Under Development.
The overview – from a list of links to grouped settings with a visible status.
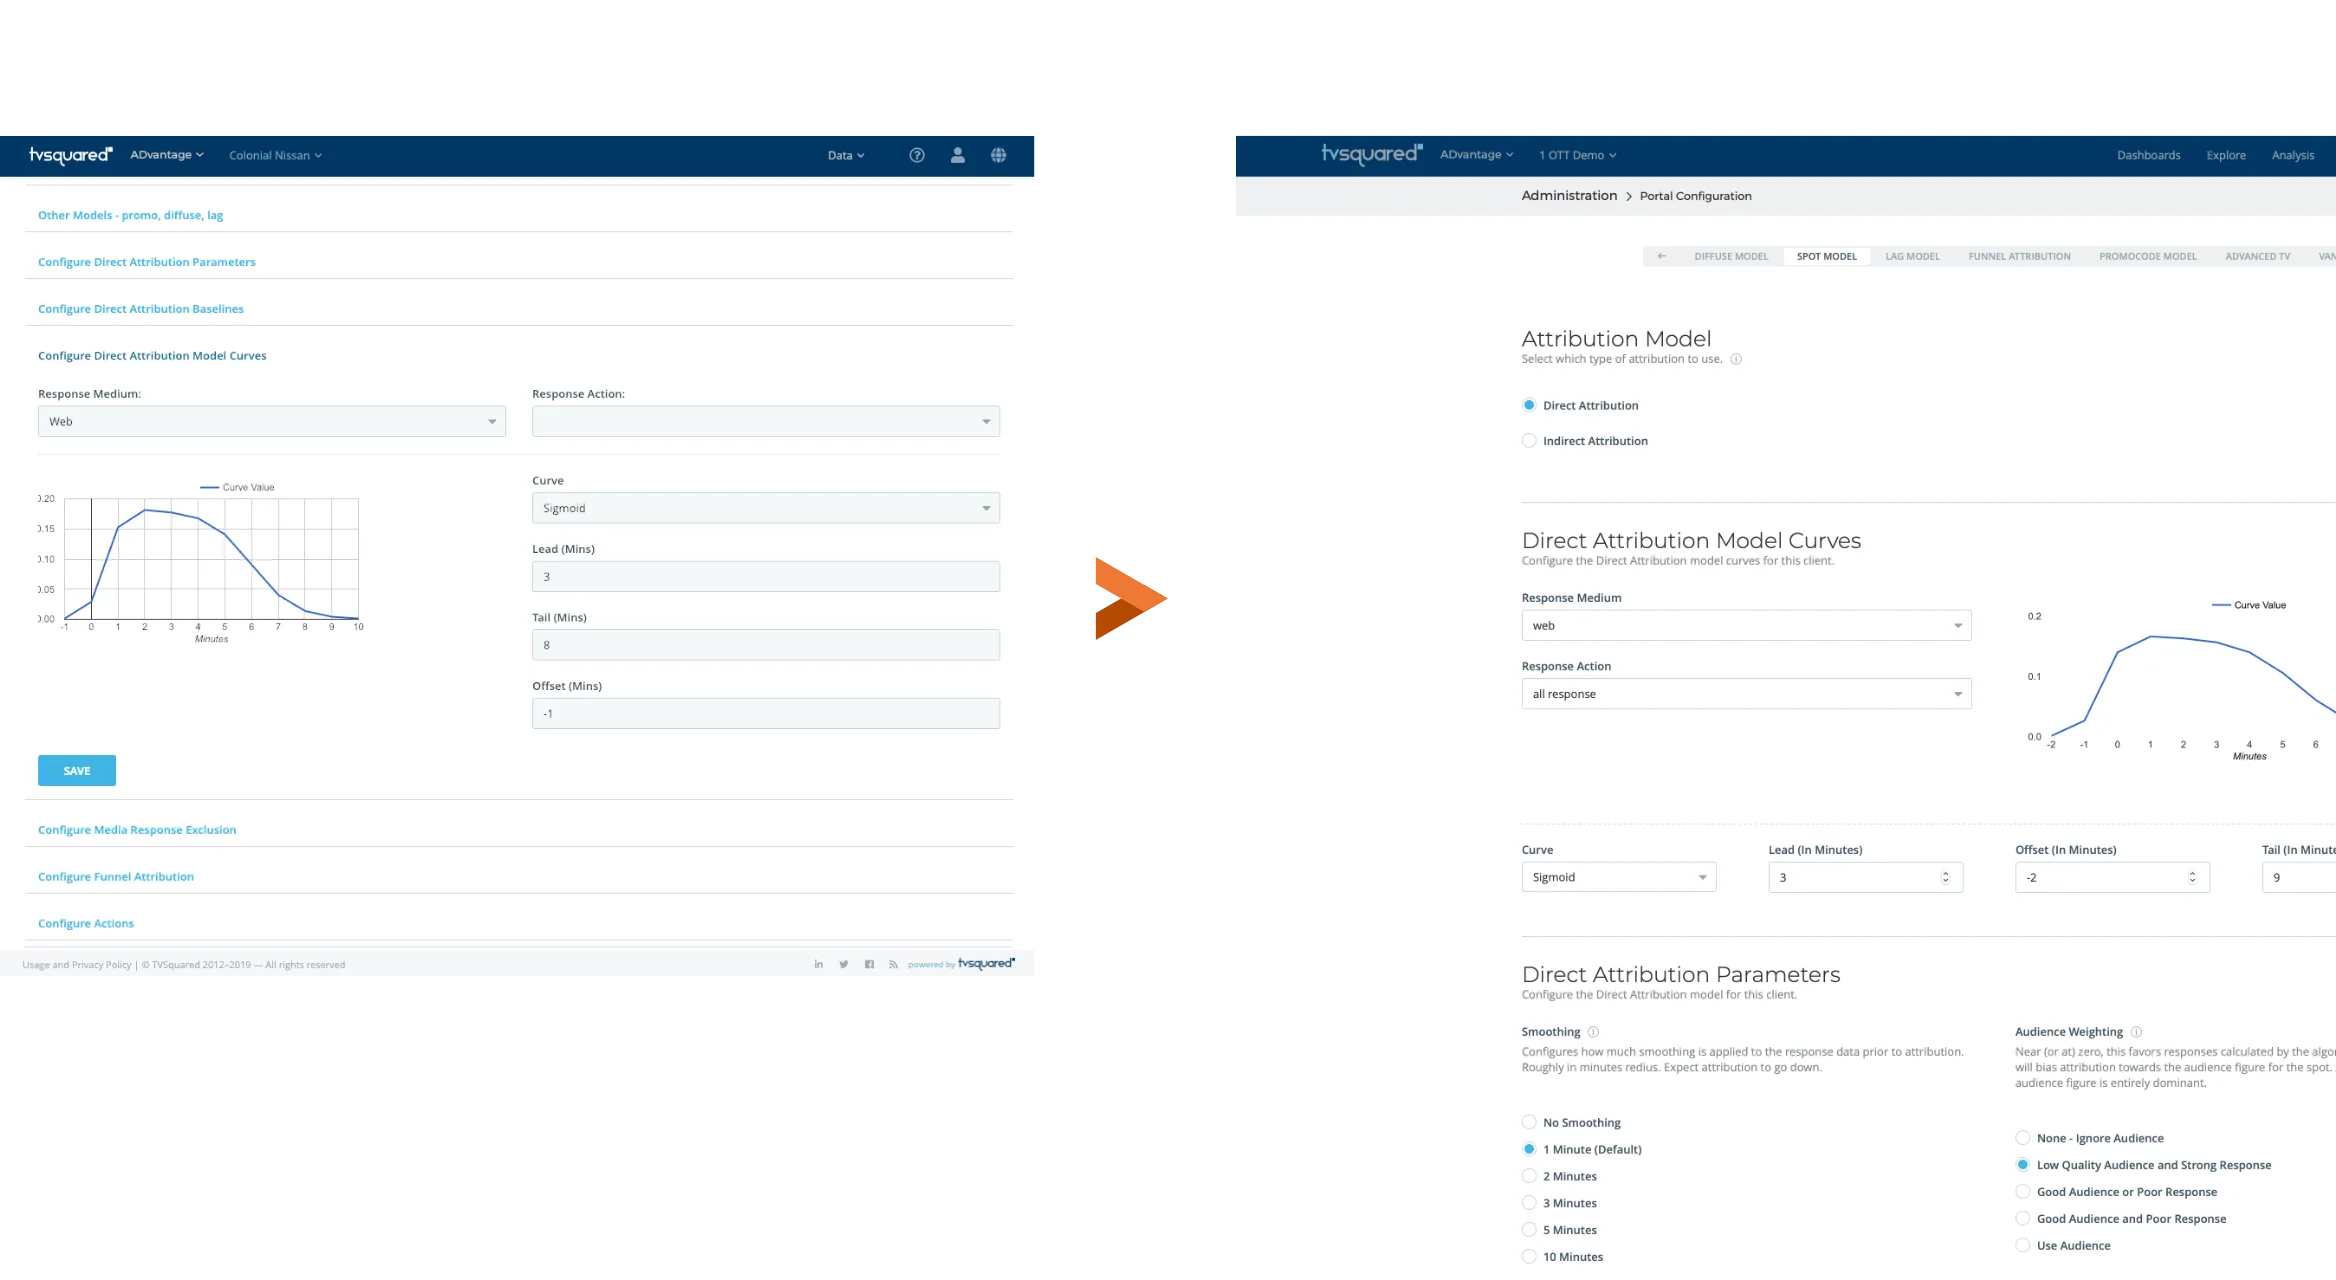
Enlarge image: Two versions of one setting, the direct attribution model curve. Left, the old page: fields and a small chart opened inside the list of links. Right, the redesign: its own page with tabs for each model, the attribution type, the curve next to its inputs, and the parameters explained in plain words below.
One setting in detail – its own page, with the options explained.

A system and a front door for design.

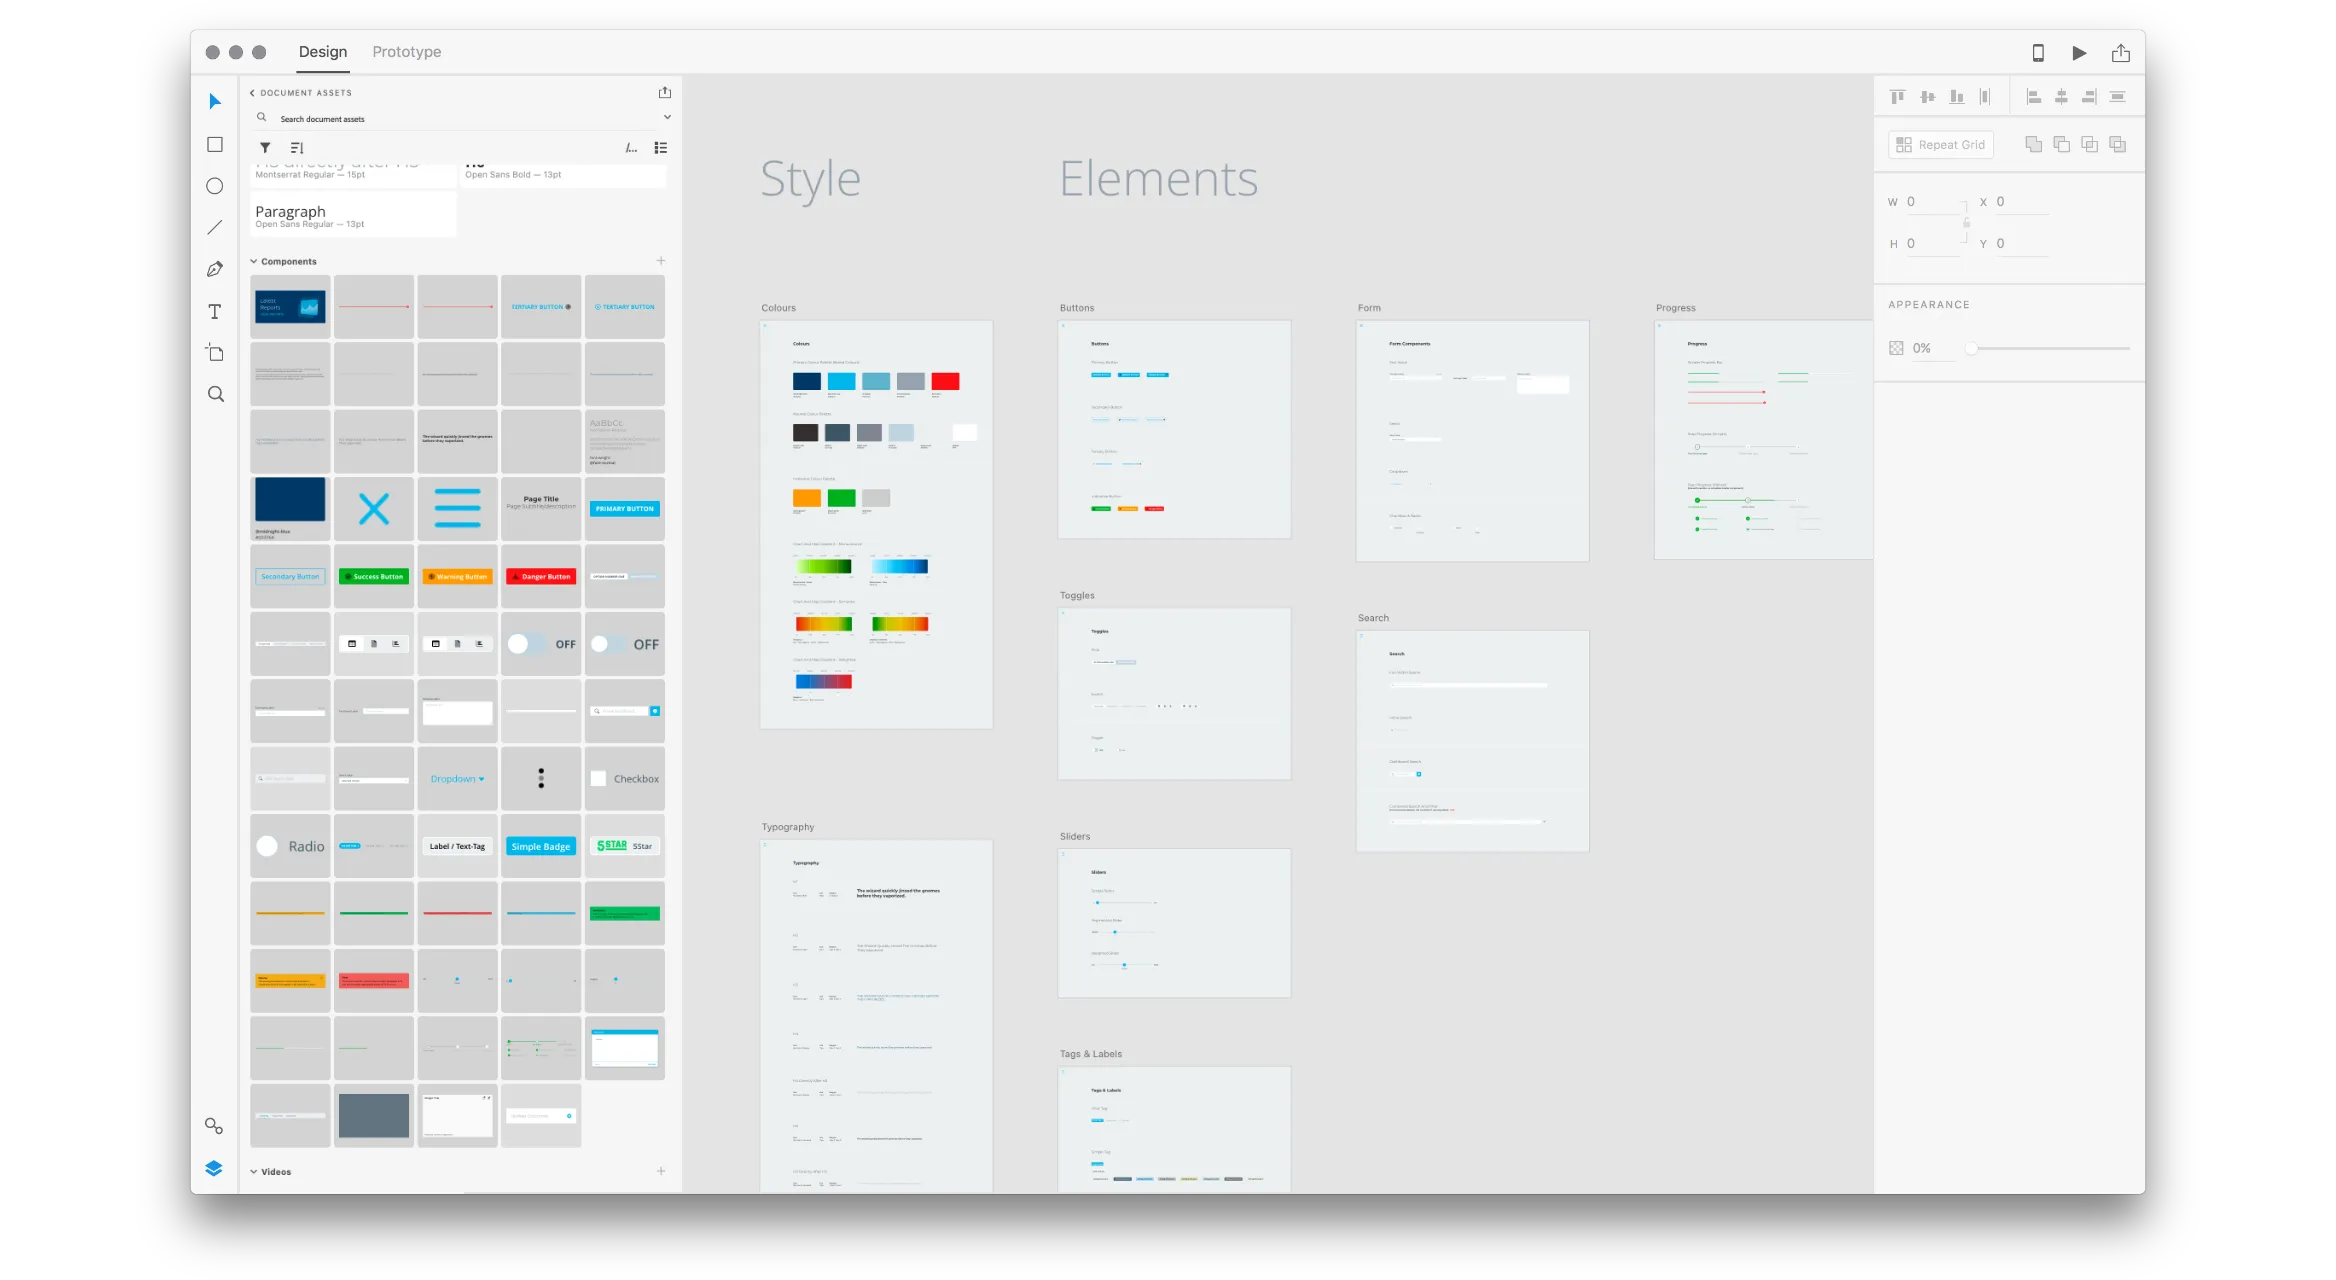
The redesign came with a new design system – styles, variables, rules and components, shared with developers through Zeplin. Around it, a clear workflow from Product through design to development, so UX and UI questions finally had somewhere to go.

Enlarge image: The design system in Adobe XD: boards for colours, typography, buttons, form elements, toggles, sliders, search, progress and tags, with the document’s components – buttons, toggles, badges, dropdowns and more – listed in the assets panel beside them.
The design system in XD – styles, elements and shared components.
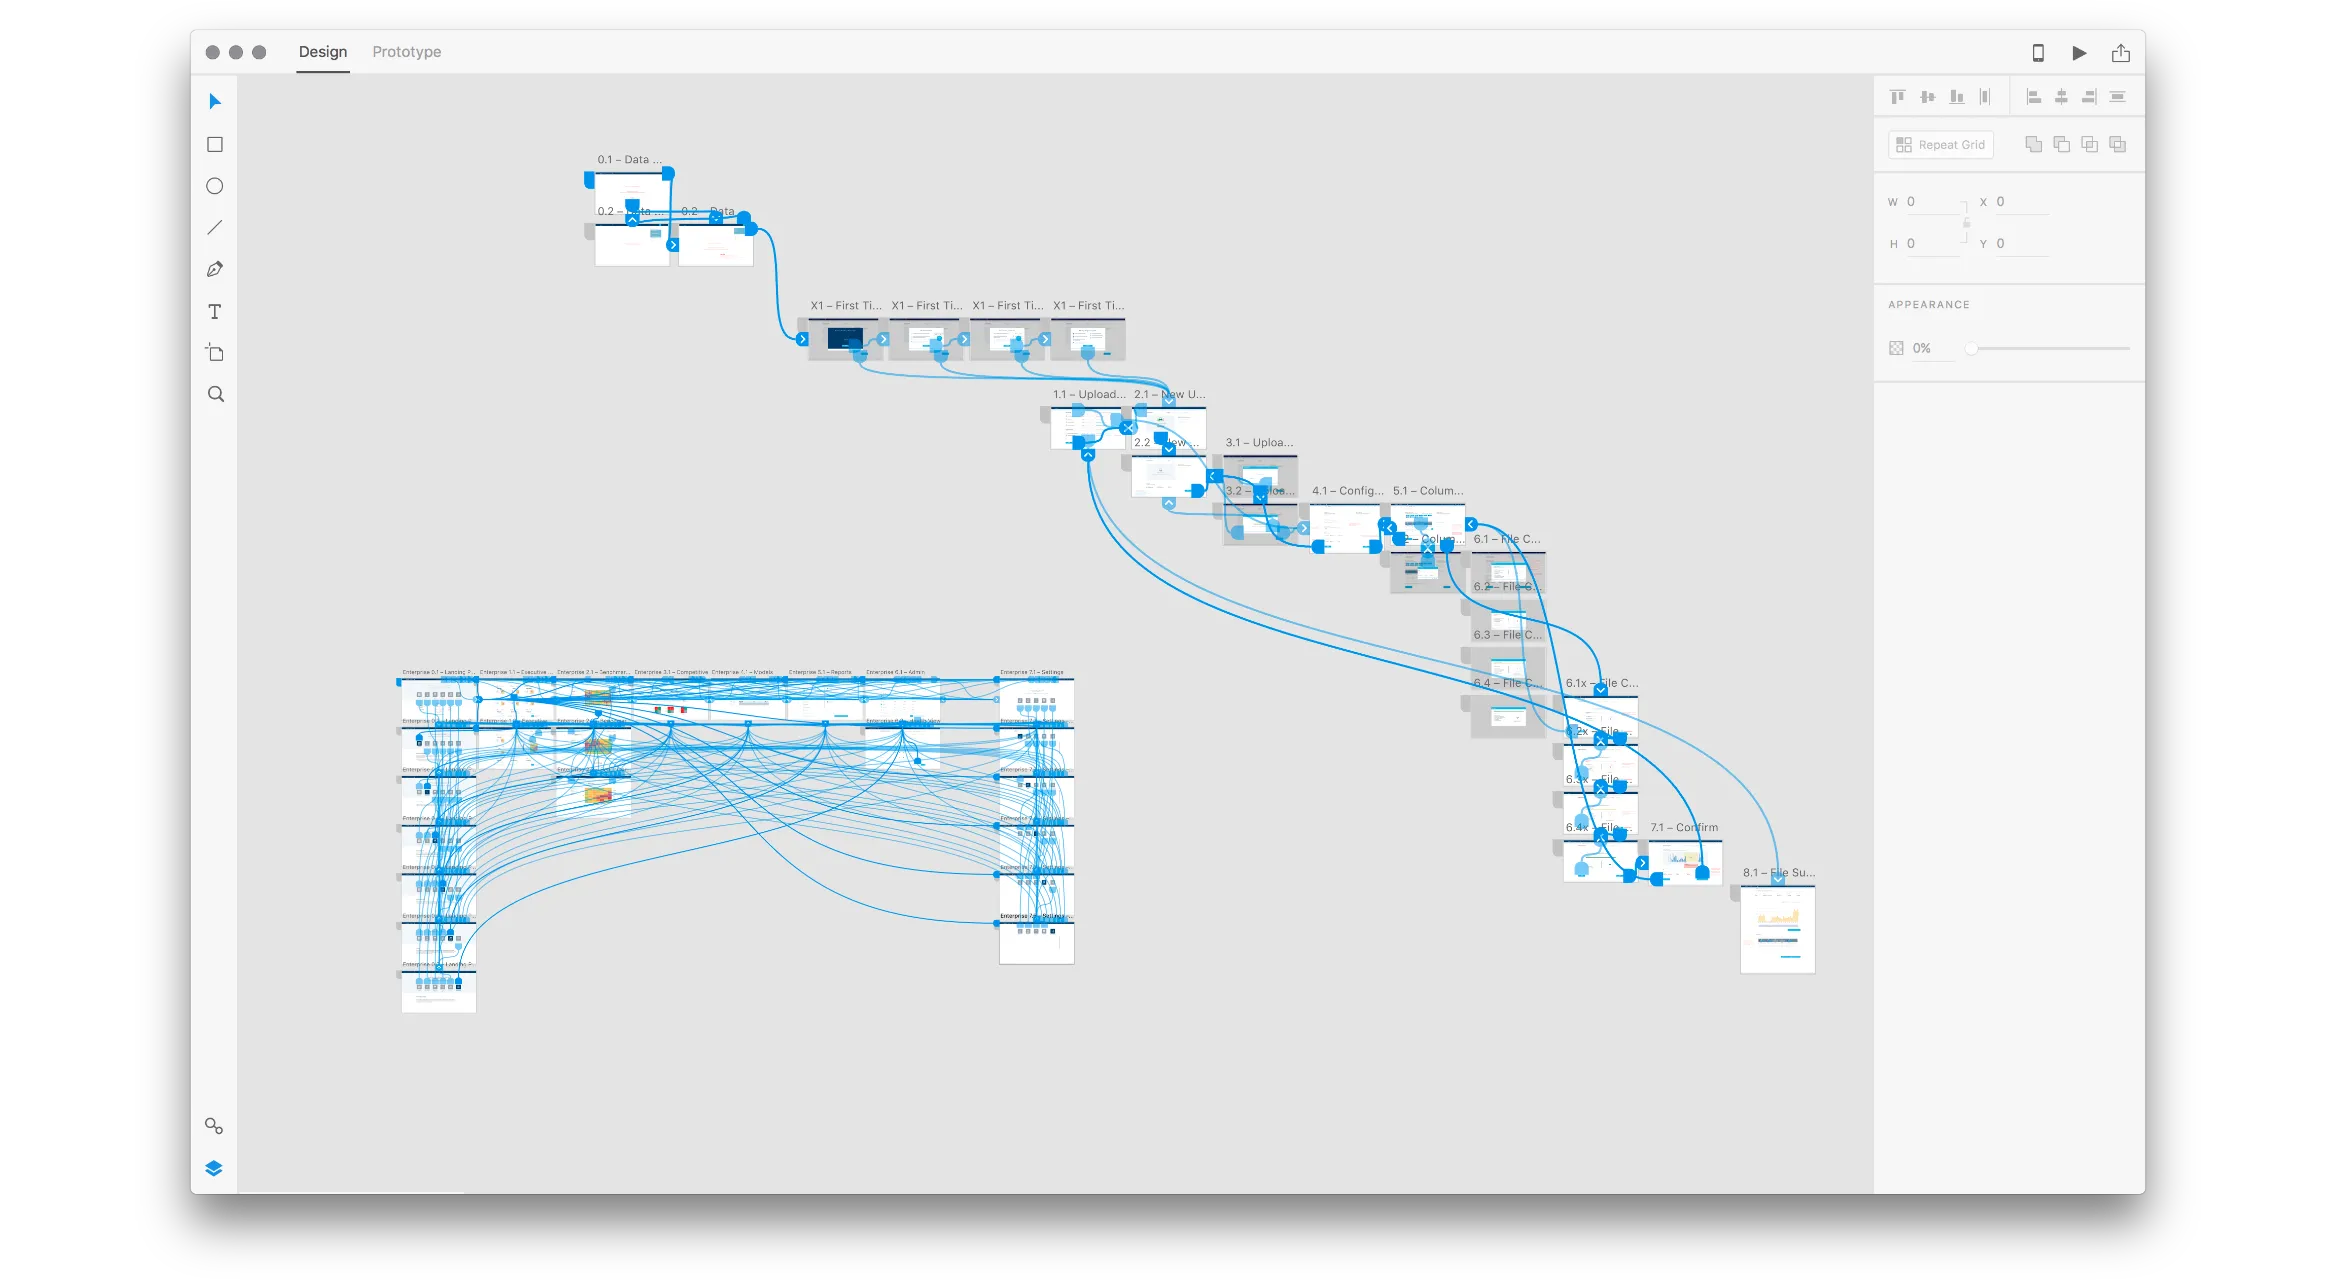
Enlarge image: An Adobe XD file in prototype view: a chain of screens from first login through uploading and checking a data file to confirmation, connected by blue interaction lines, and a dense grid of enterprise screens linked to each other.
Flows wired up in XD, so developers could click through them before building.

Result

Design became part of how things were built.

I was in every daily stand-up and retrospective. Design tasks had tickets just like any development task, decisions could be traced back, and QA had a place to go with questions about UI changes or bugs.

Looking back

What I’d do differently.

I’d spend more time with customers directly, not only through Sales. And I’d write the process down sooner. Much of it lived in my head and in stand-ups at first, which worked while I was the only designer but slowed things down once the team grew.

Contact

Let’s make it simple.

Open to freelance projects, full-time roles, and interesting conversations.

Visit me on LinkedIn