All work

7 min read

TVSquared · 2018–20

Beyond the spike.

New TVSquared products, from first sketch to launch – measuring TV’s longer-term impact, syncing search ads with TV spots, and forecasting what a change to the media plan would do.

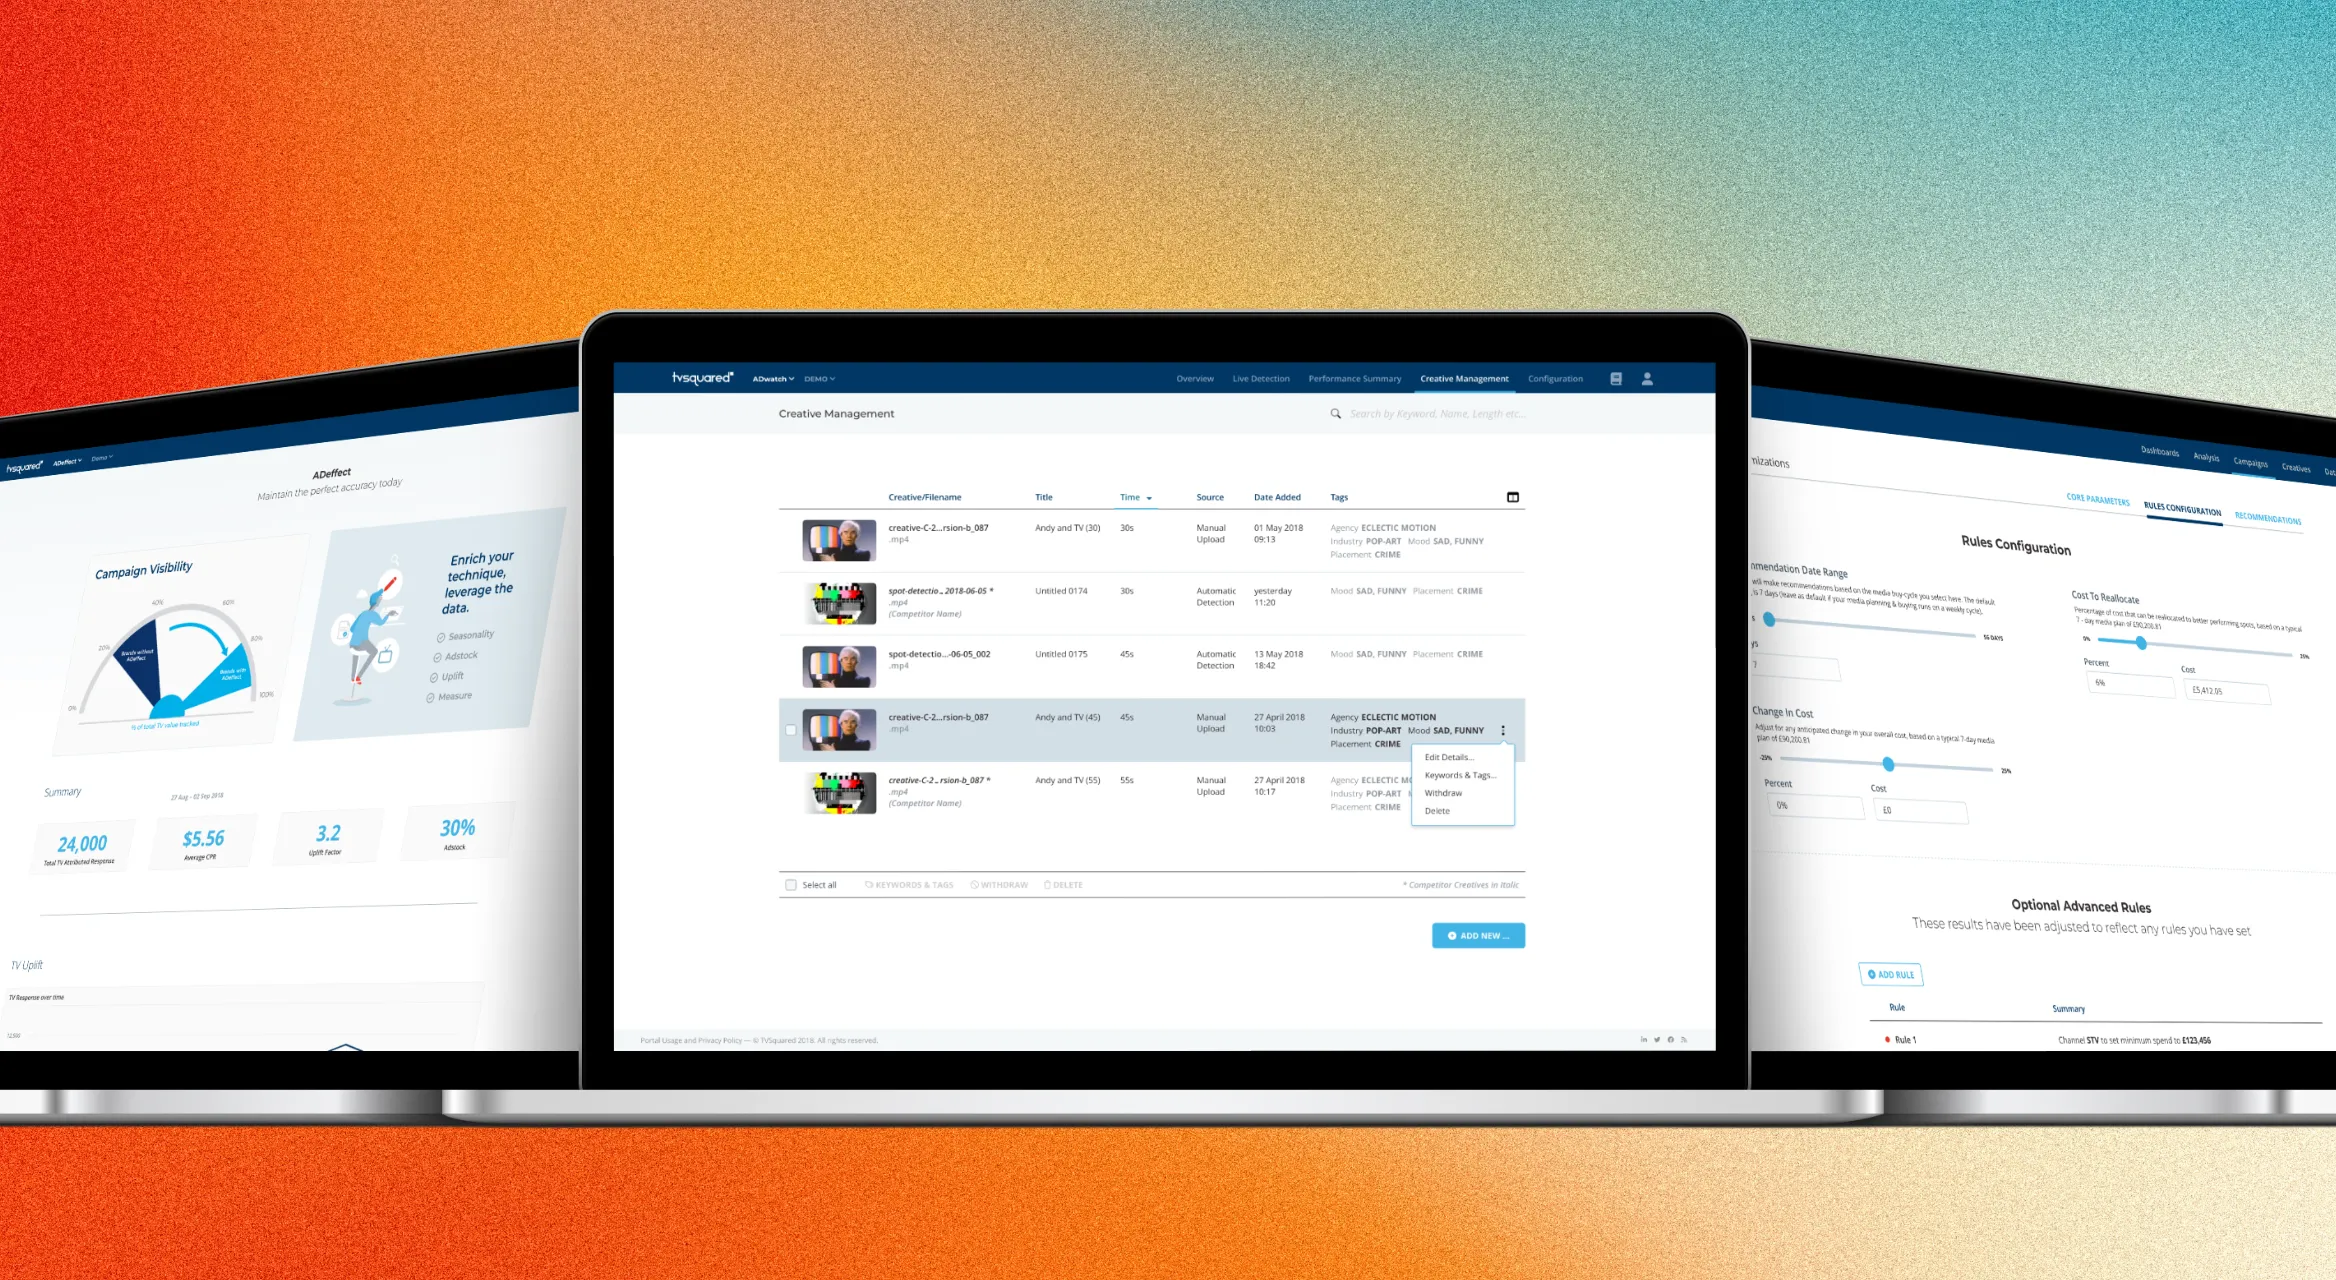
Enlarge image: Three laptops in front of an orange-to-teal gradient. The middle one shows Creative Management: a list of TV creatives with thumbnails, length, source, date added and tags. On the left, an early ADeffect page with a gauge for campaign visibility and four key figures; on the right, Predict’s Rules Configuration with sliders and a list of advanced rules.
ADeffect, Creative Management and Predict.

At a glance

ADvantage showed advertisers what their TV ad did in the minutes after it aired. Over two years, TVSquared built new products around it, each answering the question clients asked next. I designed them from the first sketches to the final screens, and for ADeffect also the material that launched it.

Client
TVSquared
Industry
TV and streaming ad analytics
My role
UI/UX Designer, Digital Product Designer
Duration
2018–20
Platform
Web (SaaS)
Tools
Adobe XD, HTML/CSS, Illustrator, Photoshop
Deliverables
Product concepts, UI design, launch website and portal banner

The challenge

Many new questions.

ADvantage answered one question well: how did my TV spot do? The spike in website visits or app installs right after a spot aired was what TVSquared measured best.

Clients kept asking the next questions. What does TV do after the spike? Can I react while my ad is on air? What’s working for other brands? And what happens if I change my plan? All the while, data had to remain understandable. Each of these questions became a new product, sold next to ADvantage and built on the same data, so each needed its own place without feeling like a different tool.

Approach

One answer per product.

One portal, many products.

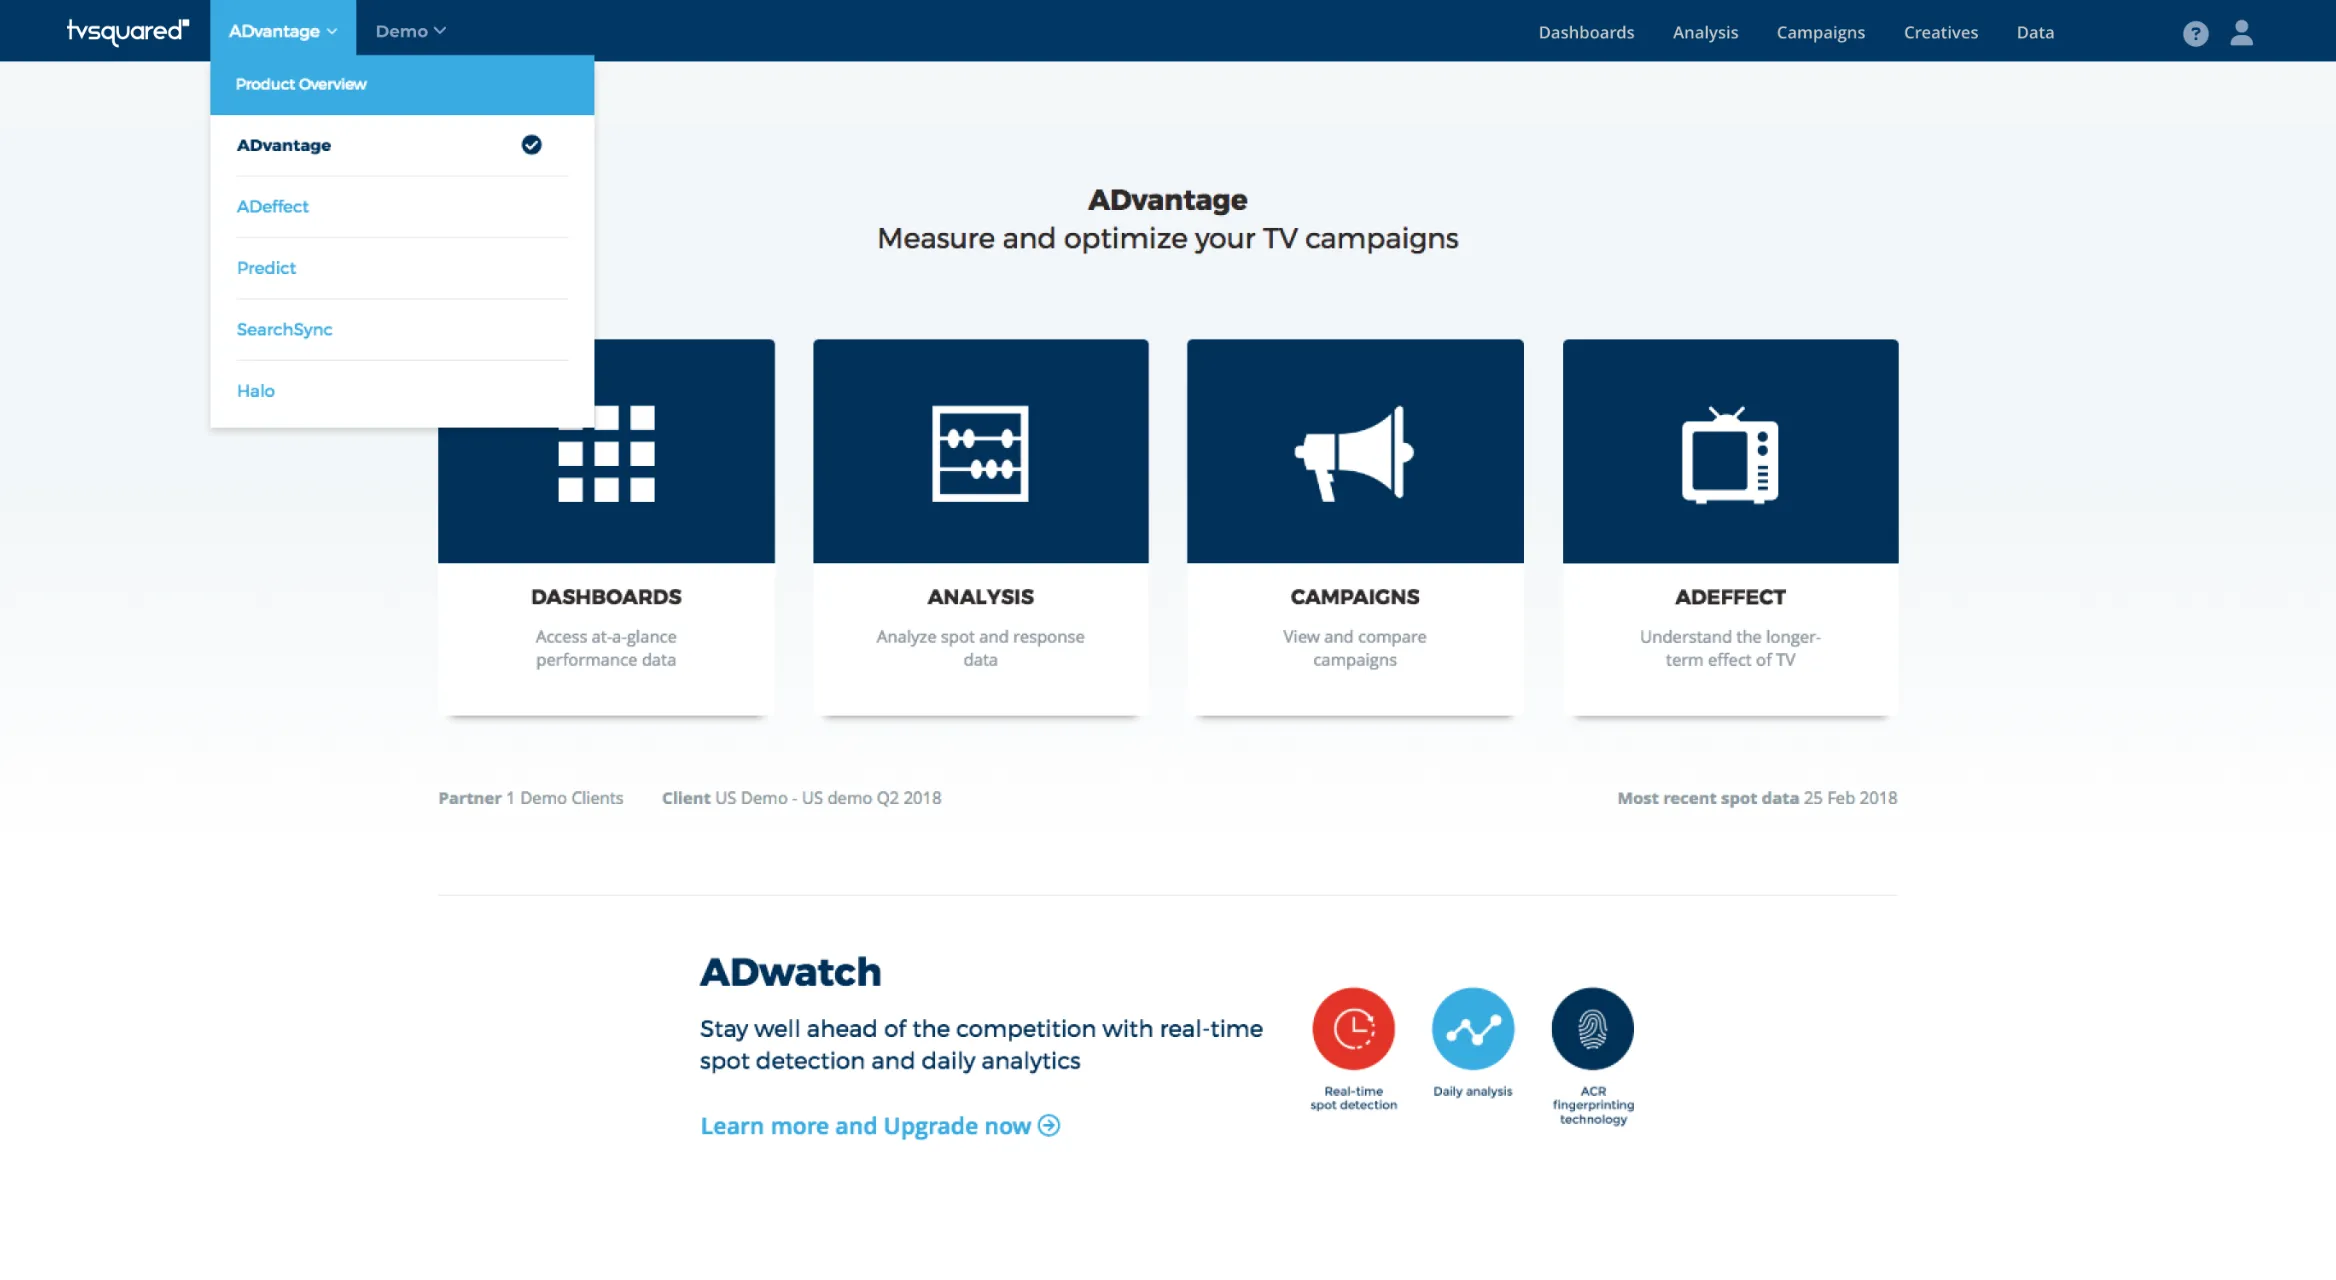
Every new product lived inside the same portal as ADvantage. A product menu in the header switched between them, the ADvantage start page gave each one a tile, and clients who didn’t have a product yet saw what it could do for them, with a way to upgrade.

Enlarge image: The ADvantage start page with the product menu open in the header, listing ADvantage, ADeffect, Predict, SearchSync and Halo. Below it, four tiles for Dashboards, Analysis, Campaigns and ADeffect, and a promotion for ADwatch – real-time spot detection and daily analytics – with a link to upgrade.
ADeffect as a tile on the start page, and the product menu that tied the suite together.

ADeffect – what TV does after the spike.

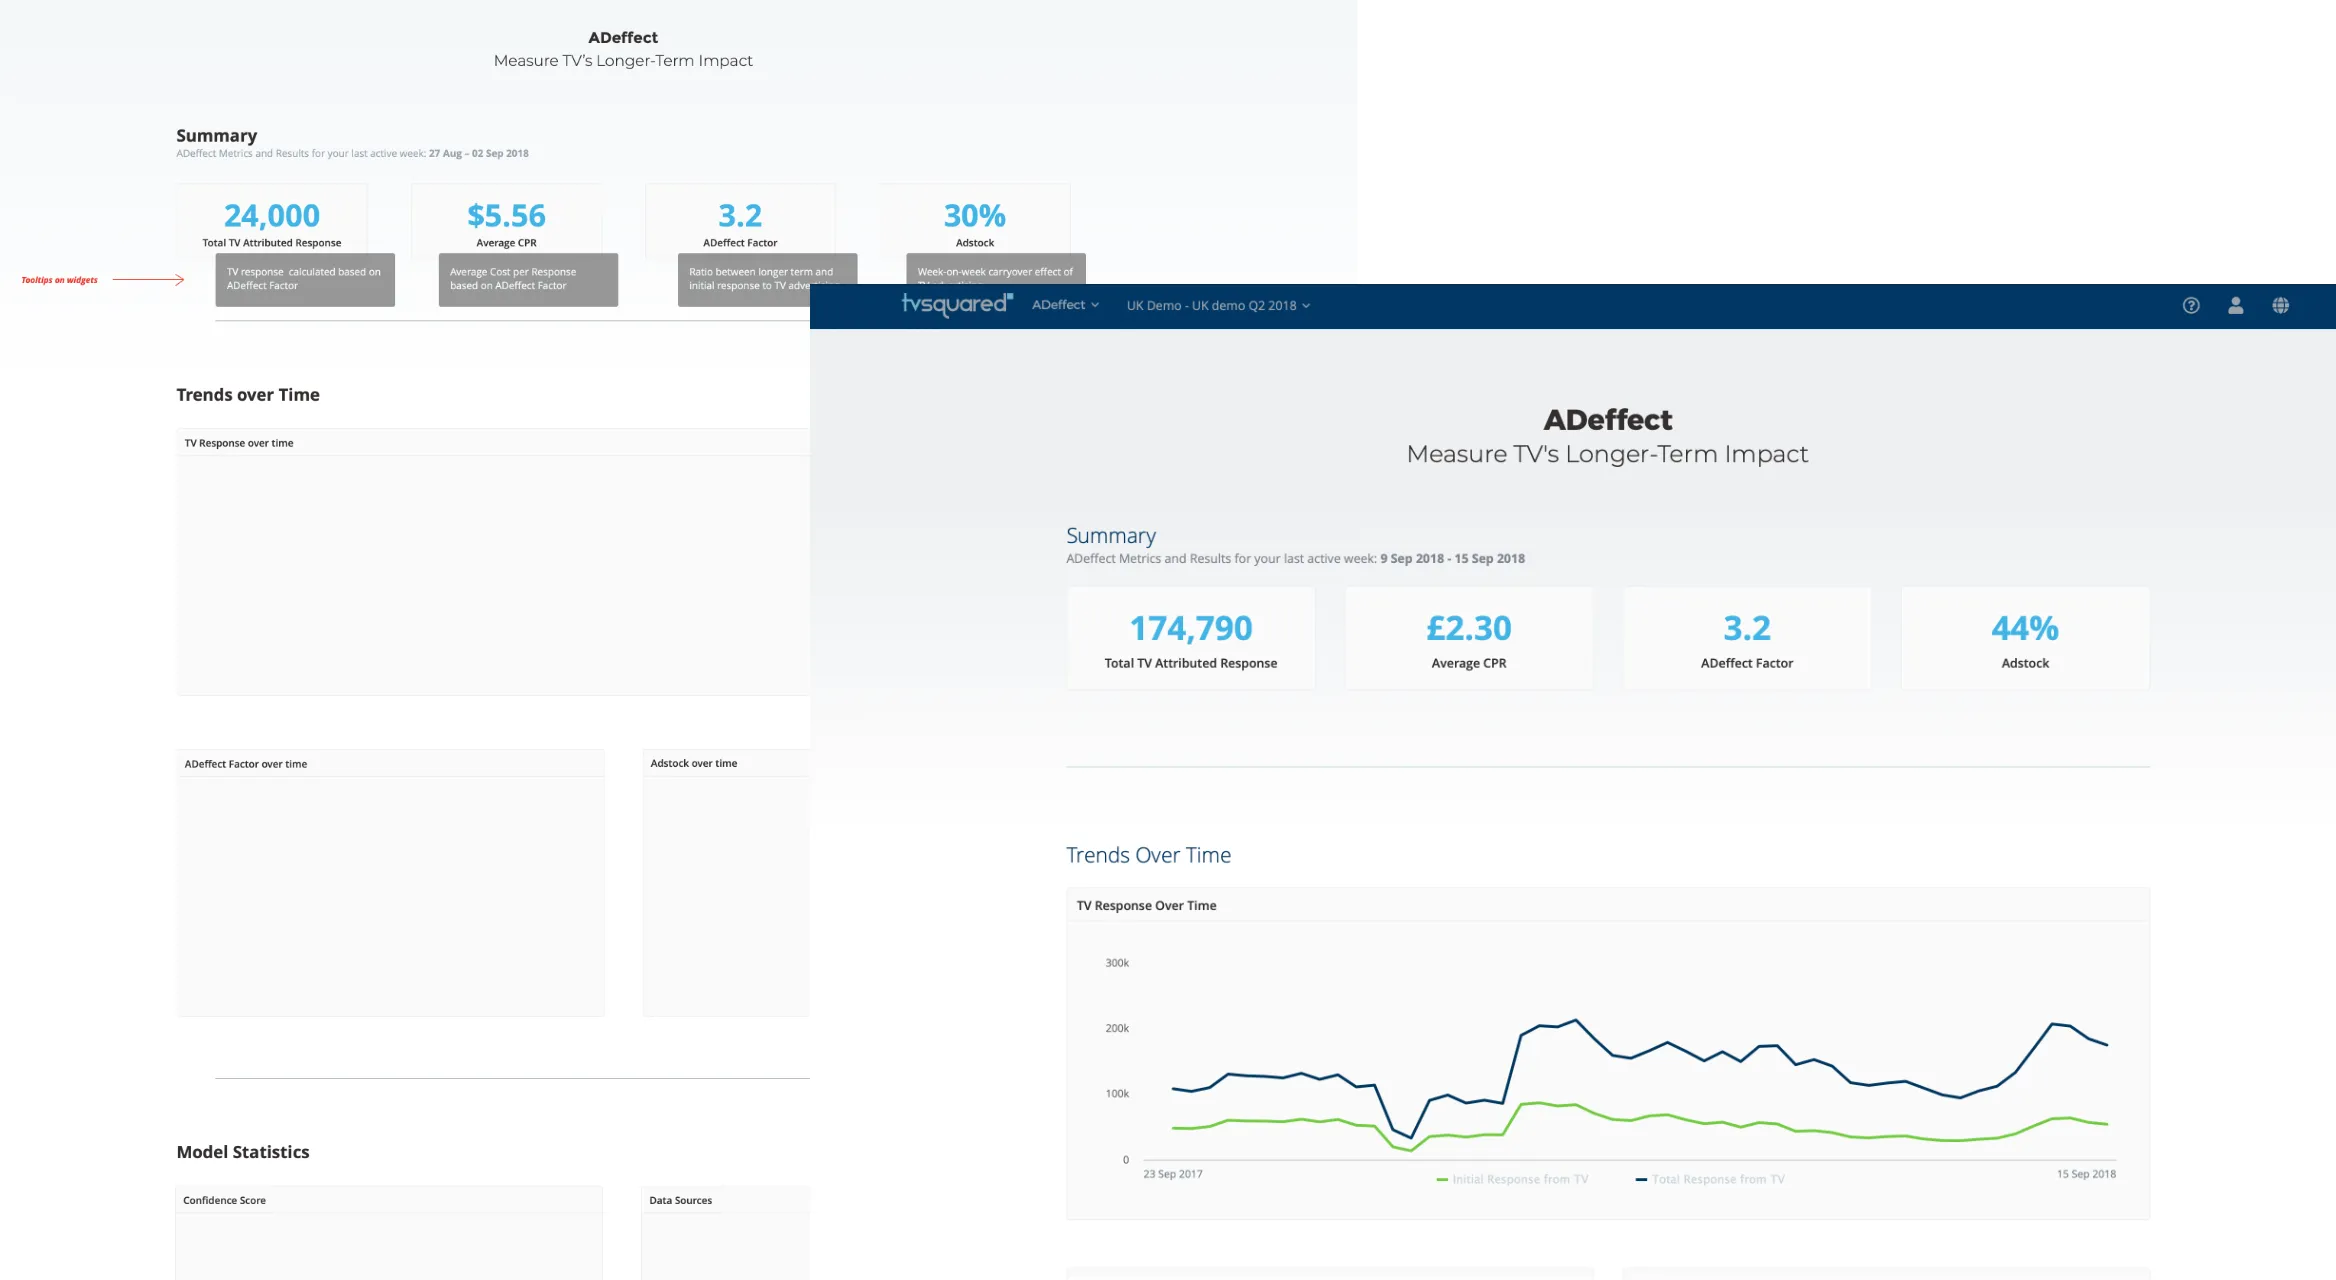
ADeffect looked backwards. It measured how long an ad kept working after it aired – the adstock – and how much more response TV drove in total than the first spike suggested. I took it from early layouts to the final page: four key figures up front, trends over time below, and the model’s confidence and data sources at the end, so users could judge how far to trust the numbers.

Enlarge image: Two versions of the ADeffect page, one over the other. Behind, an early layout with four key figures, grey tooltips explaining each one, and empty boxes for trends and model statistics. In front, the live page: total TV attributed response, average cost per response, the ADeffect factor and adstock, above a chart of initial and total TV response over a year.
From early layout to the live page.

Launching it.

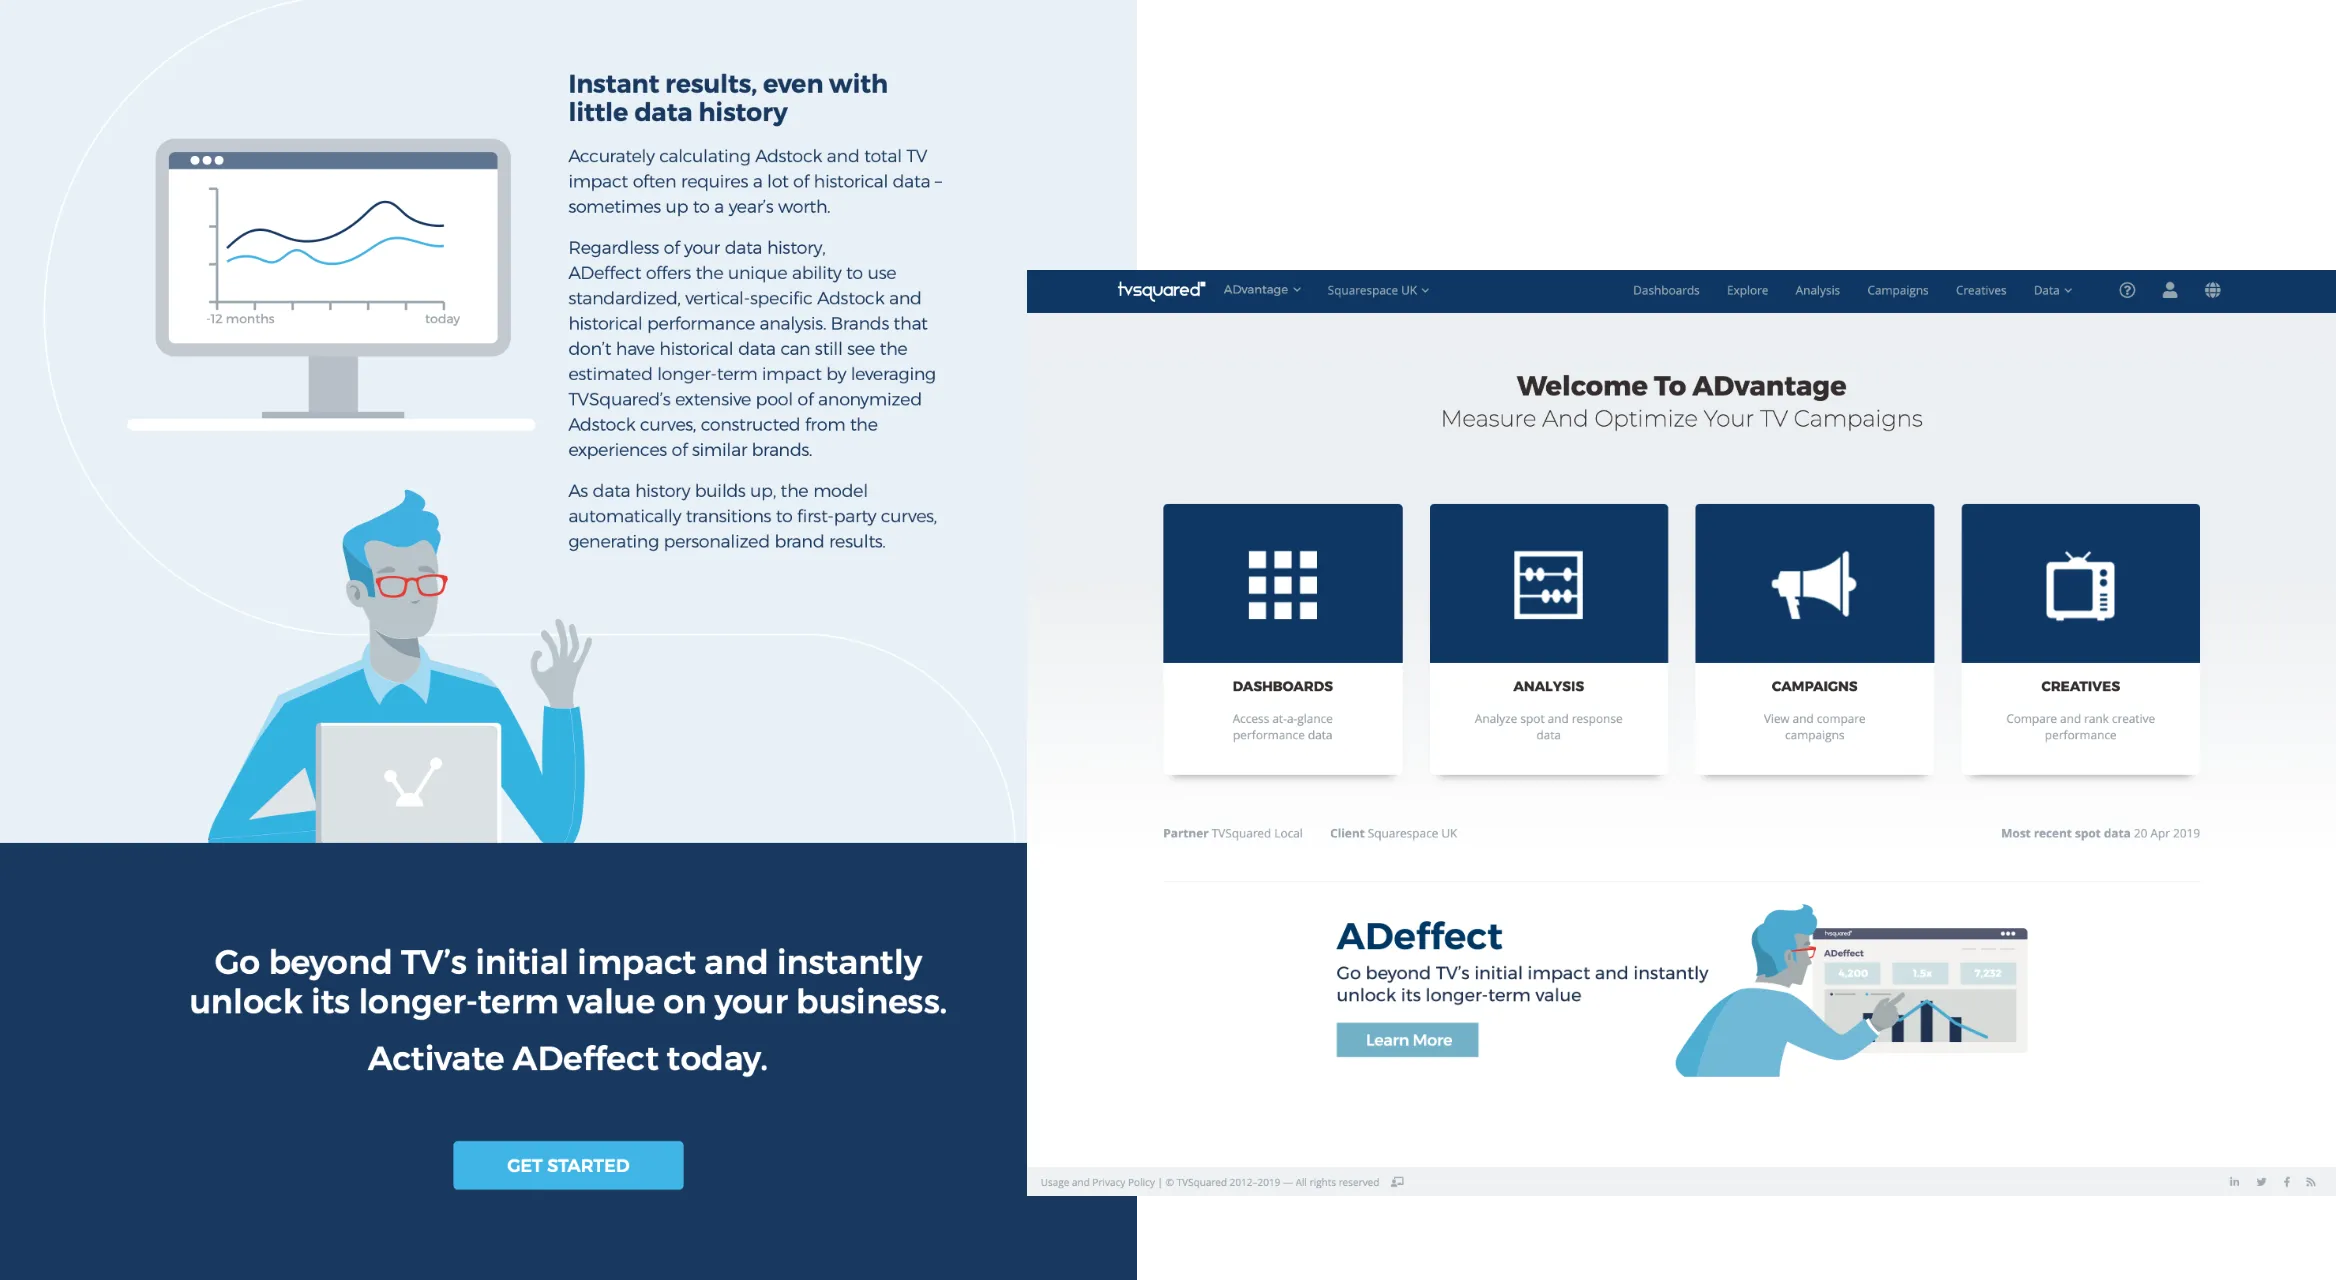
ADeffect came with a launch, and I designed the material for it: an infographic landing page, animated GIFs to bring it to life, and a banner inside ADvantage that pointed existing clients to the new product. The illustrations weren’t mine – I created the copy and designed the pages and material around them.

Enlarge image: Left, a section of the ADeffect landing page: an illustrated man at a laptop next to the text “Instant results, even with little data history”, above a dark blue call to action, “Activate ADeffect today.” Right, the ADvantage start page with its four main sections and, below them, an ADeffect banner with a Learn More button.
The landing page, and the banner that announced ADeffect inside ADvantage.

ADwatch – from a sketch to live detects.

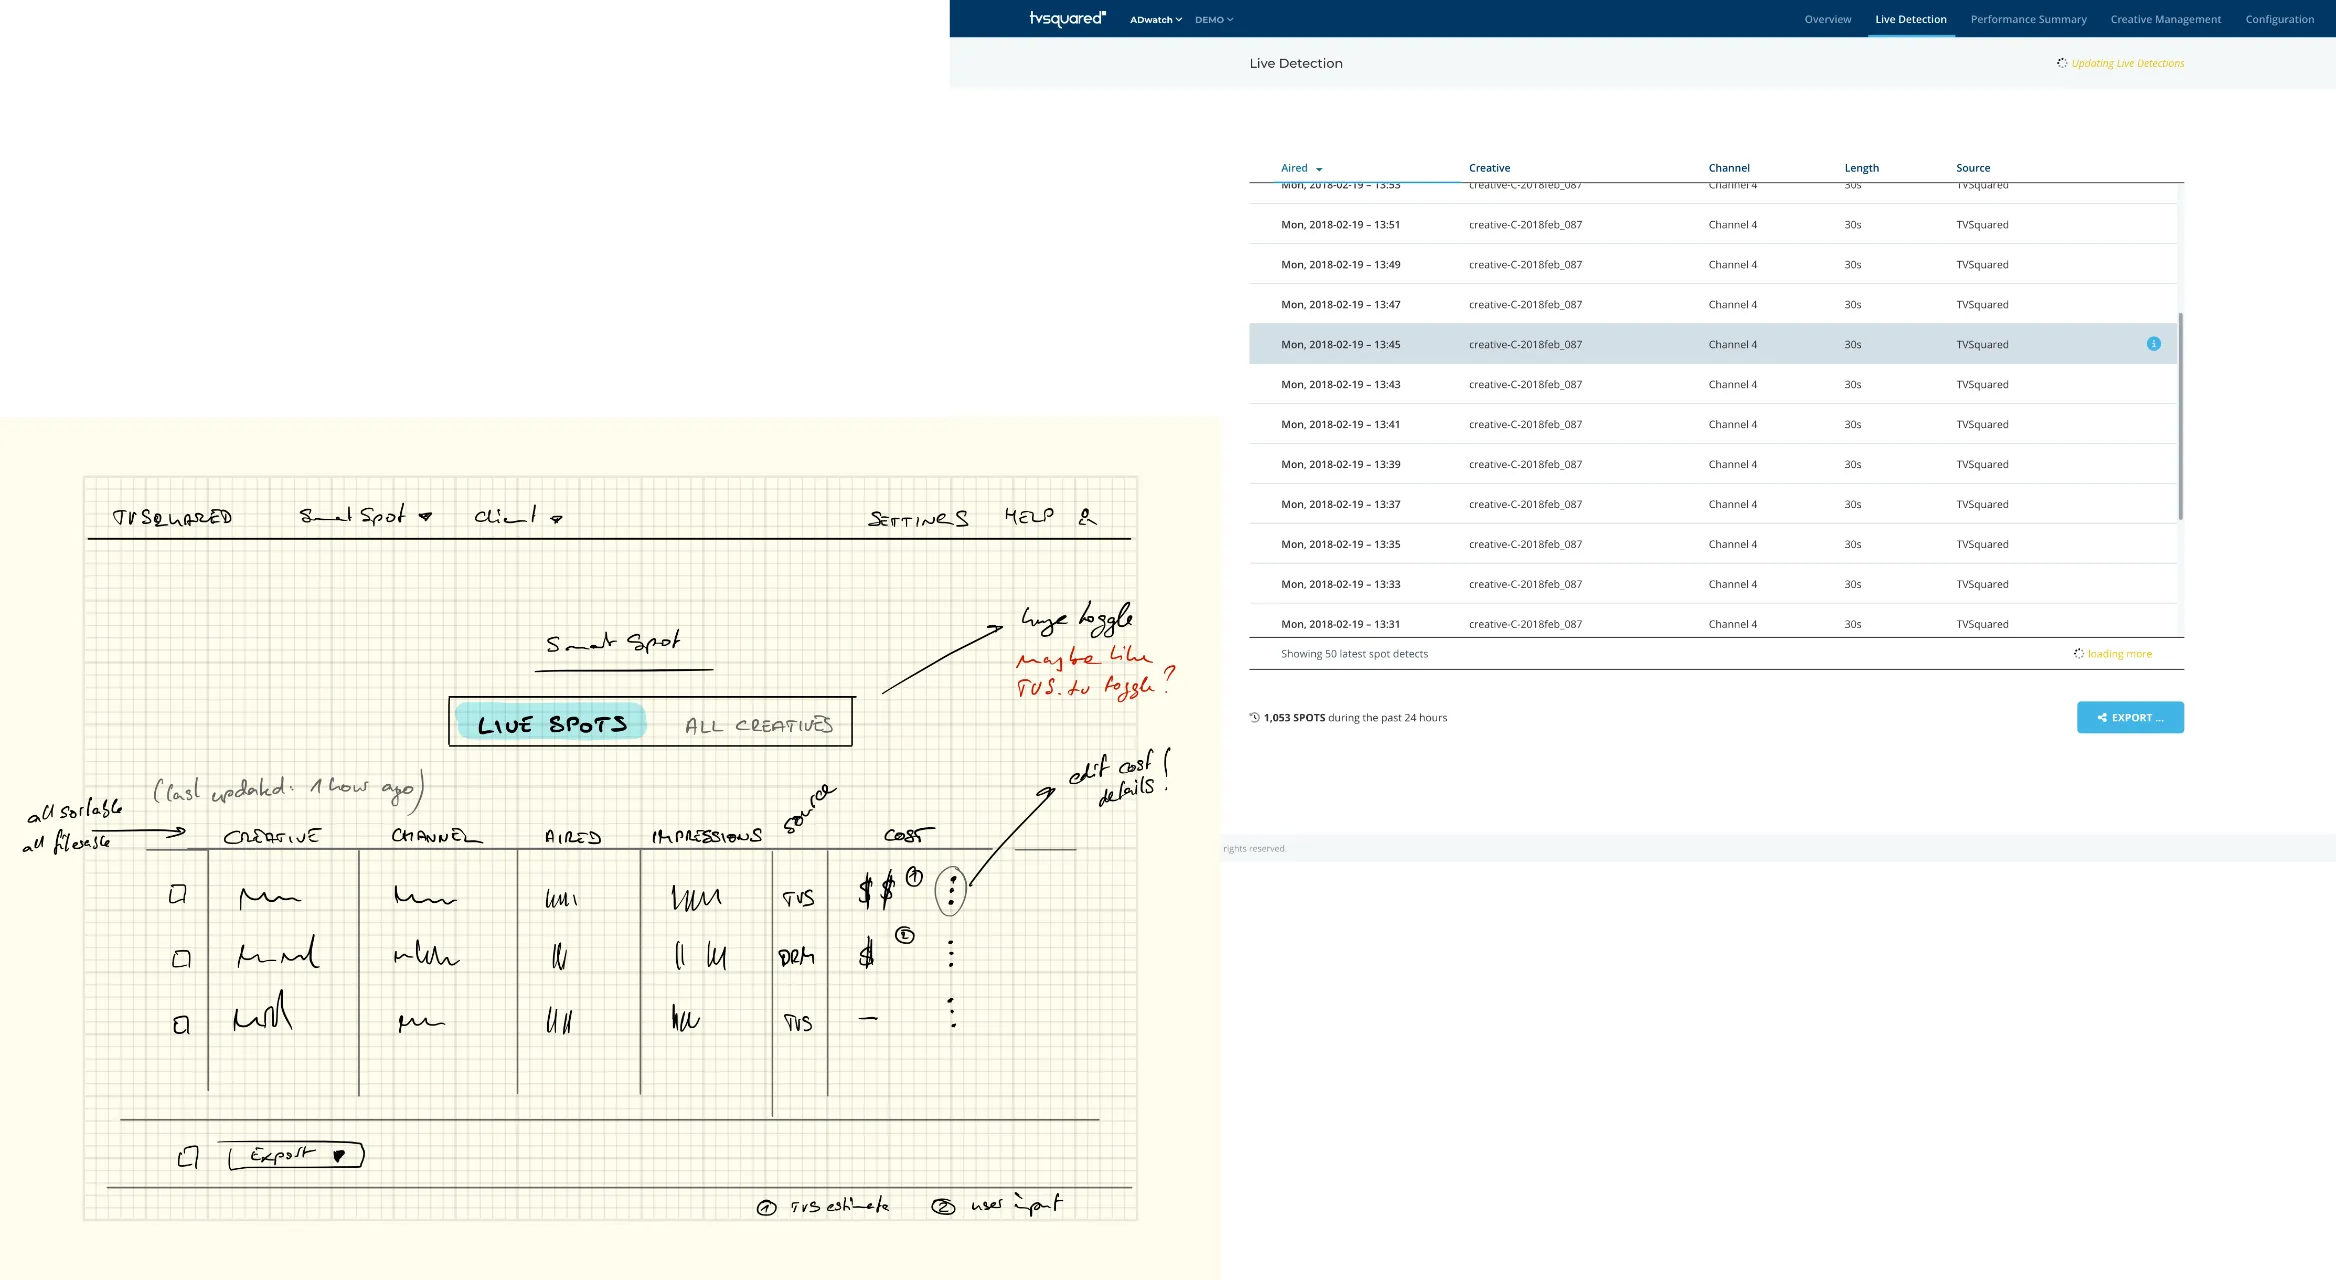
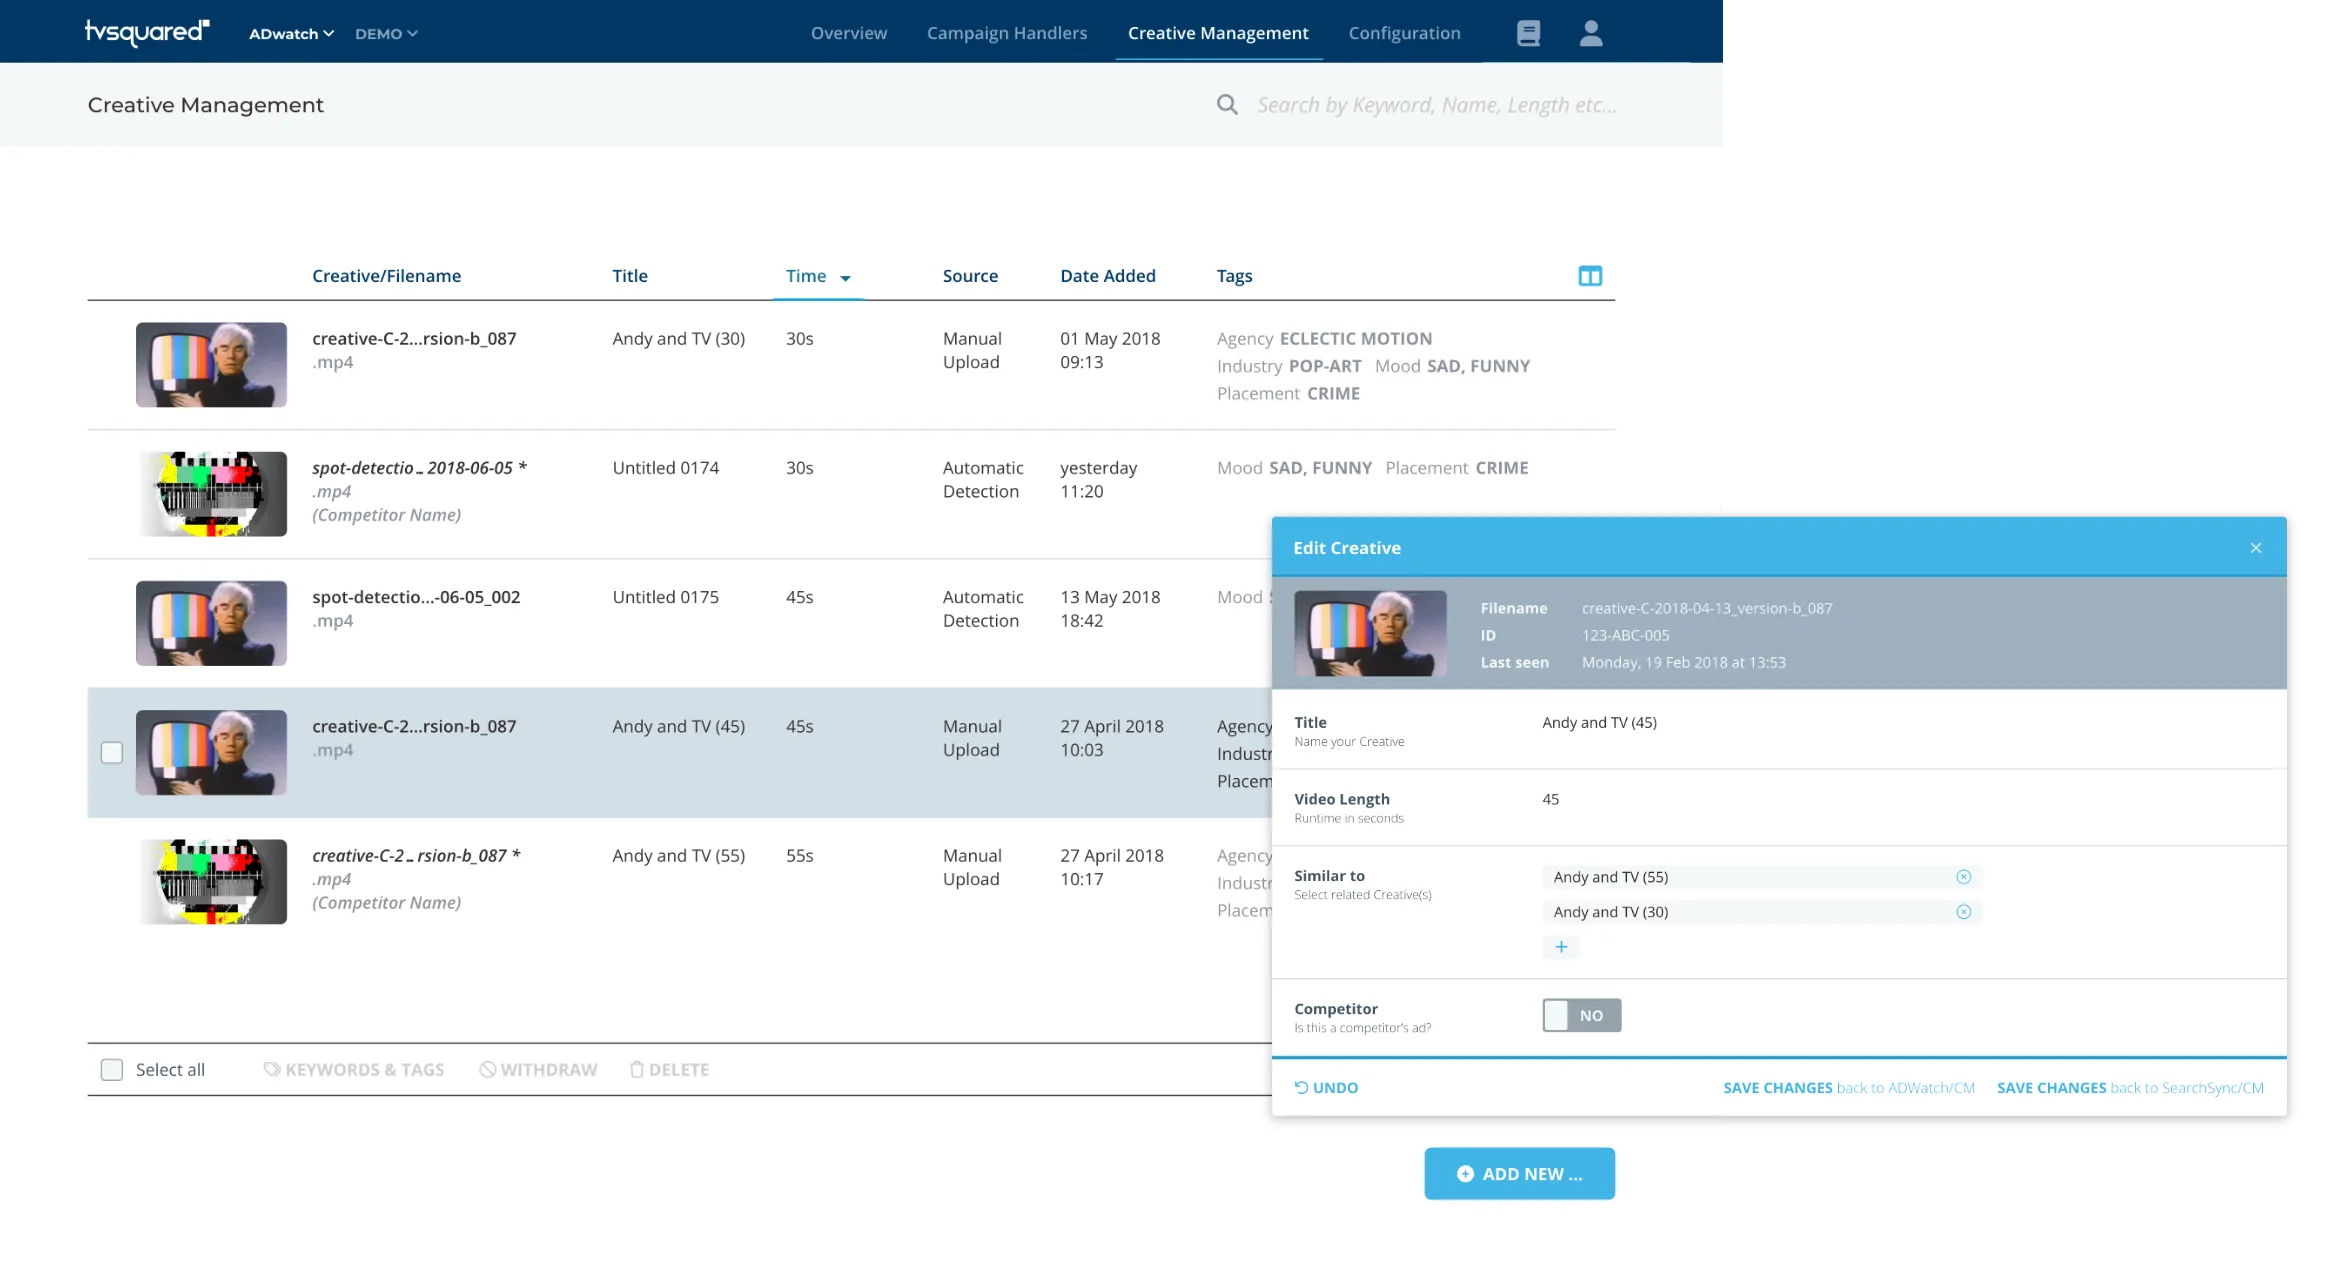
ADwatch started as three hand-drawn pages: show and manage a client’s creatives, list every time a spot was detected on air, and let clients confirm the cost of those spots before it went into any analysis. It became a product for real-time spot detection and daily analytics. At its centre was Creative Management, one library of every creative, uploaded by hand or picked up automatically by spot detection, with keywords and tags, and a switch to mark an ad as a competitor’s.

Enlarge image: In front, a sketch on grid paper: the SmartSpot page with a toggle between live spots and all creatives, above a table of creatives, channels, airtimes and costs, with handwritten notes. Behind it, the designed Live Detection screen in ADwatch: a long list of detected spots with time, creative, channel, length and source, and an export button.
The first sketch, and the Live Detection screen it became.
Enlarge image: Creative Management: a list of creatives with video thumbnails, title, length, source, date added and tags such as agency, industry and mood, with competitors’ ads in italics. Over it, the Edit Creative dialog with the file details, title, video length, similar creatives and a Competitor switch.
Creative Management – one library of creatives, including competitors’ ads.

SearchSync – search ads that follow TV.

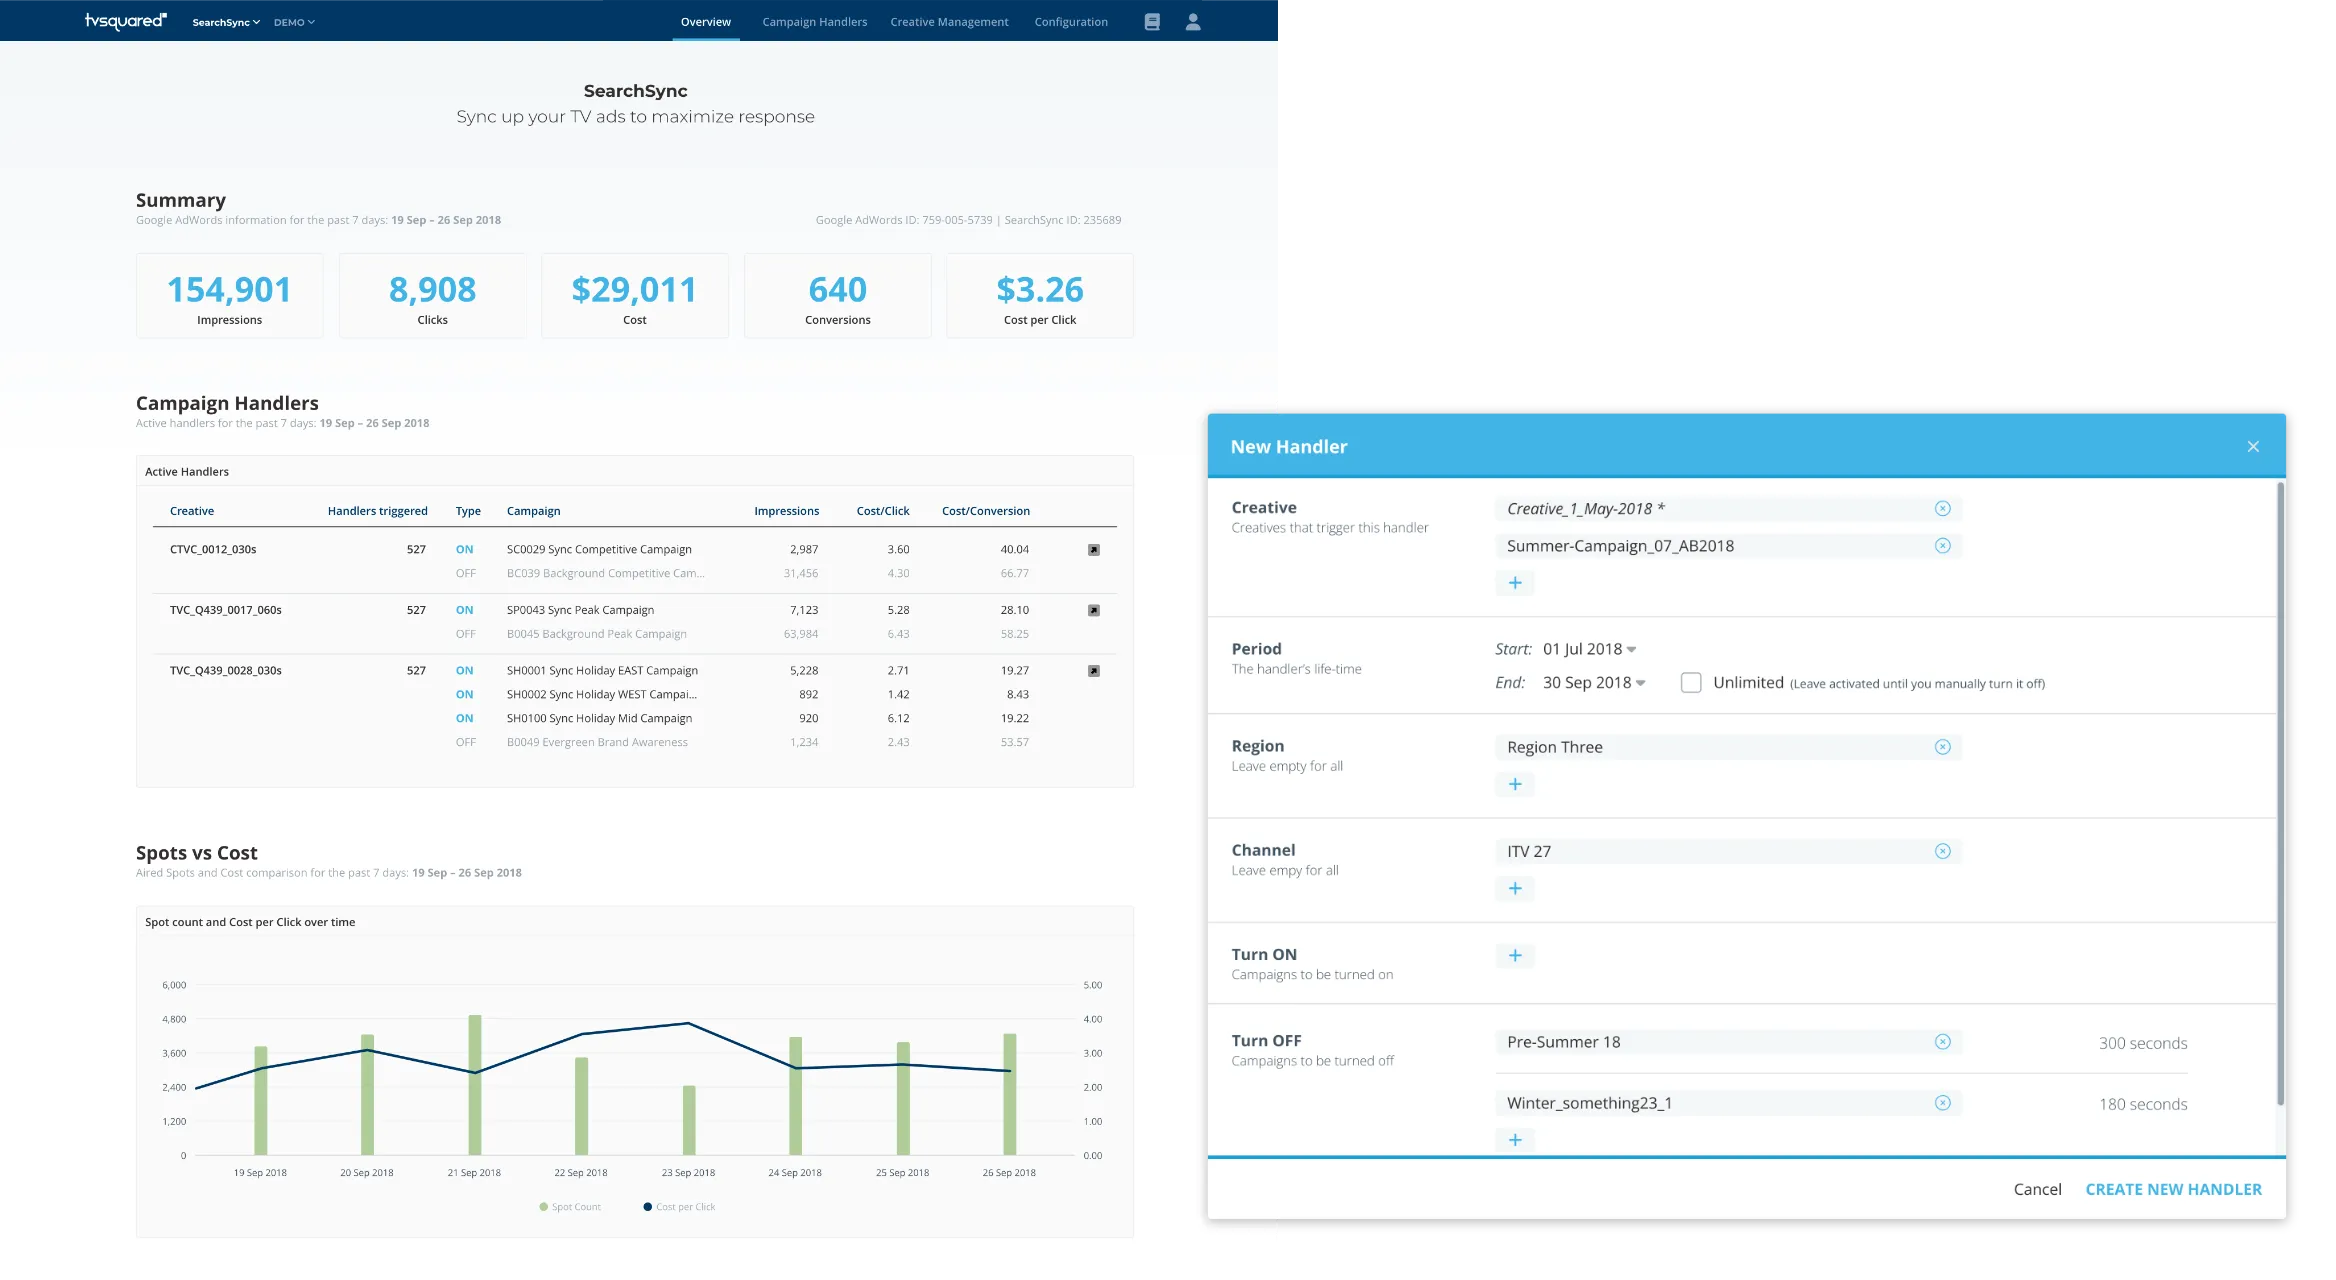
SearchSync used the same library to react while an ad was on air. Clients connected their Google AdWords account and set up handlers: when a creative aired in a given region or on a given channel, SearchSync turned chosen search campaigns on or off for a set amount of time. The interesting bit: a competitor’s ad could be the trigger too.

Enlarge image: Left, the SearchSync overview: impressions, clicks, cost, conversions and cost per click from Google AdWords, a table of creatives with the campaigns each one turned on or off, and a chart of spot count against cost per click. Right, the New Handler dialog: the creatives that trigger it, its start and end date, region, channel, and the campaigns to turn on or off for 300 and 180 seconds.
The overview, and a handler – which ads trigger which search campaigns.

dotTV – what’s working on TV.

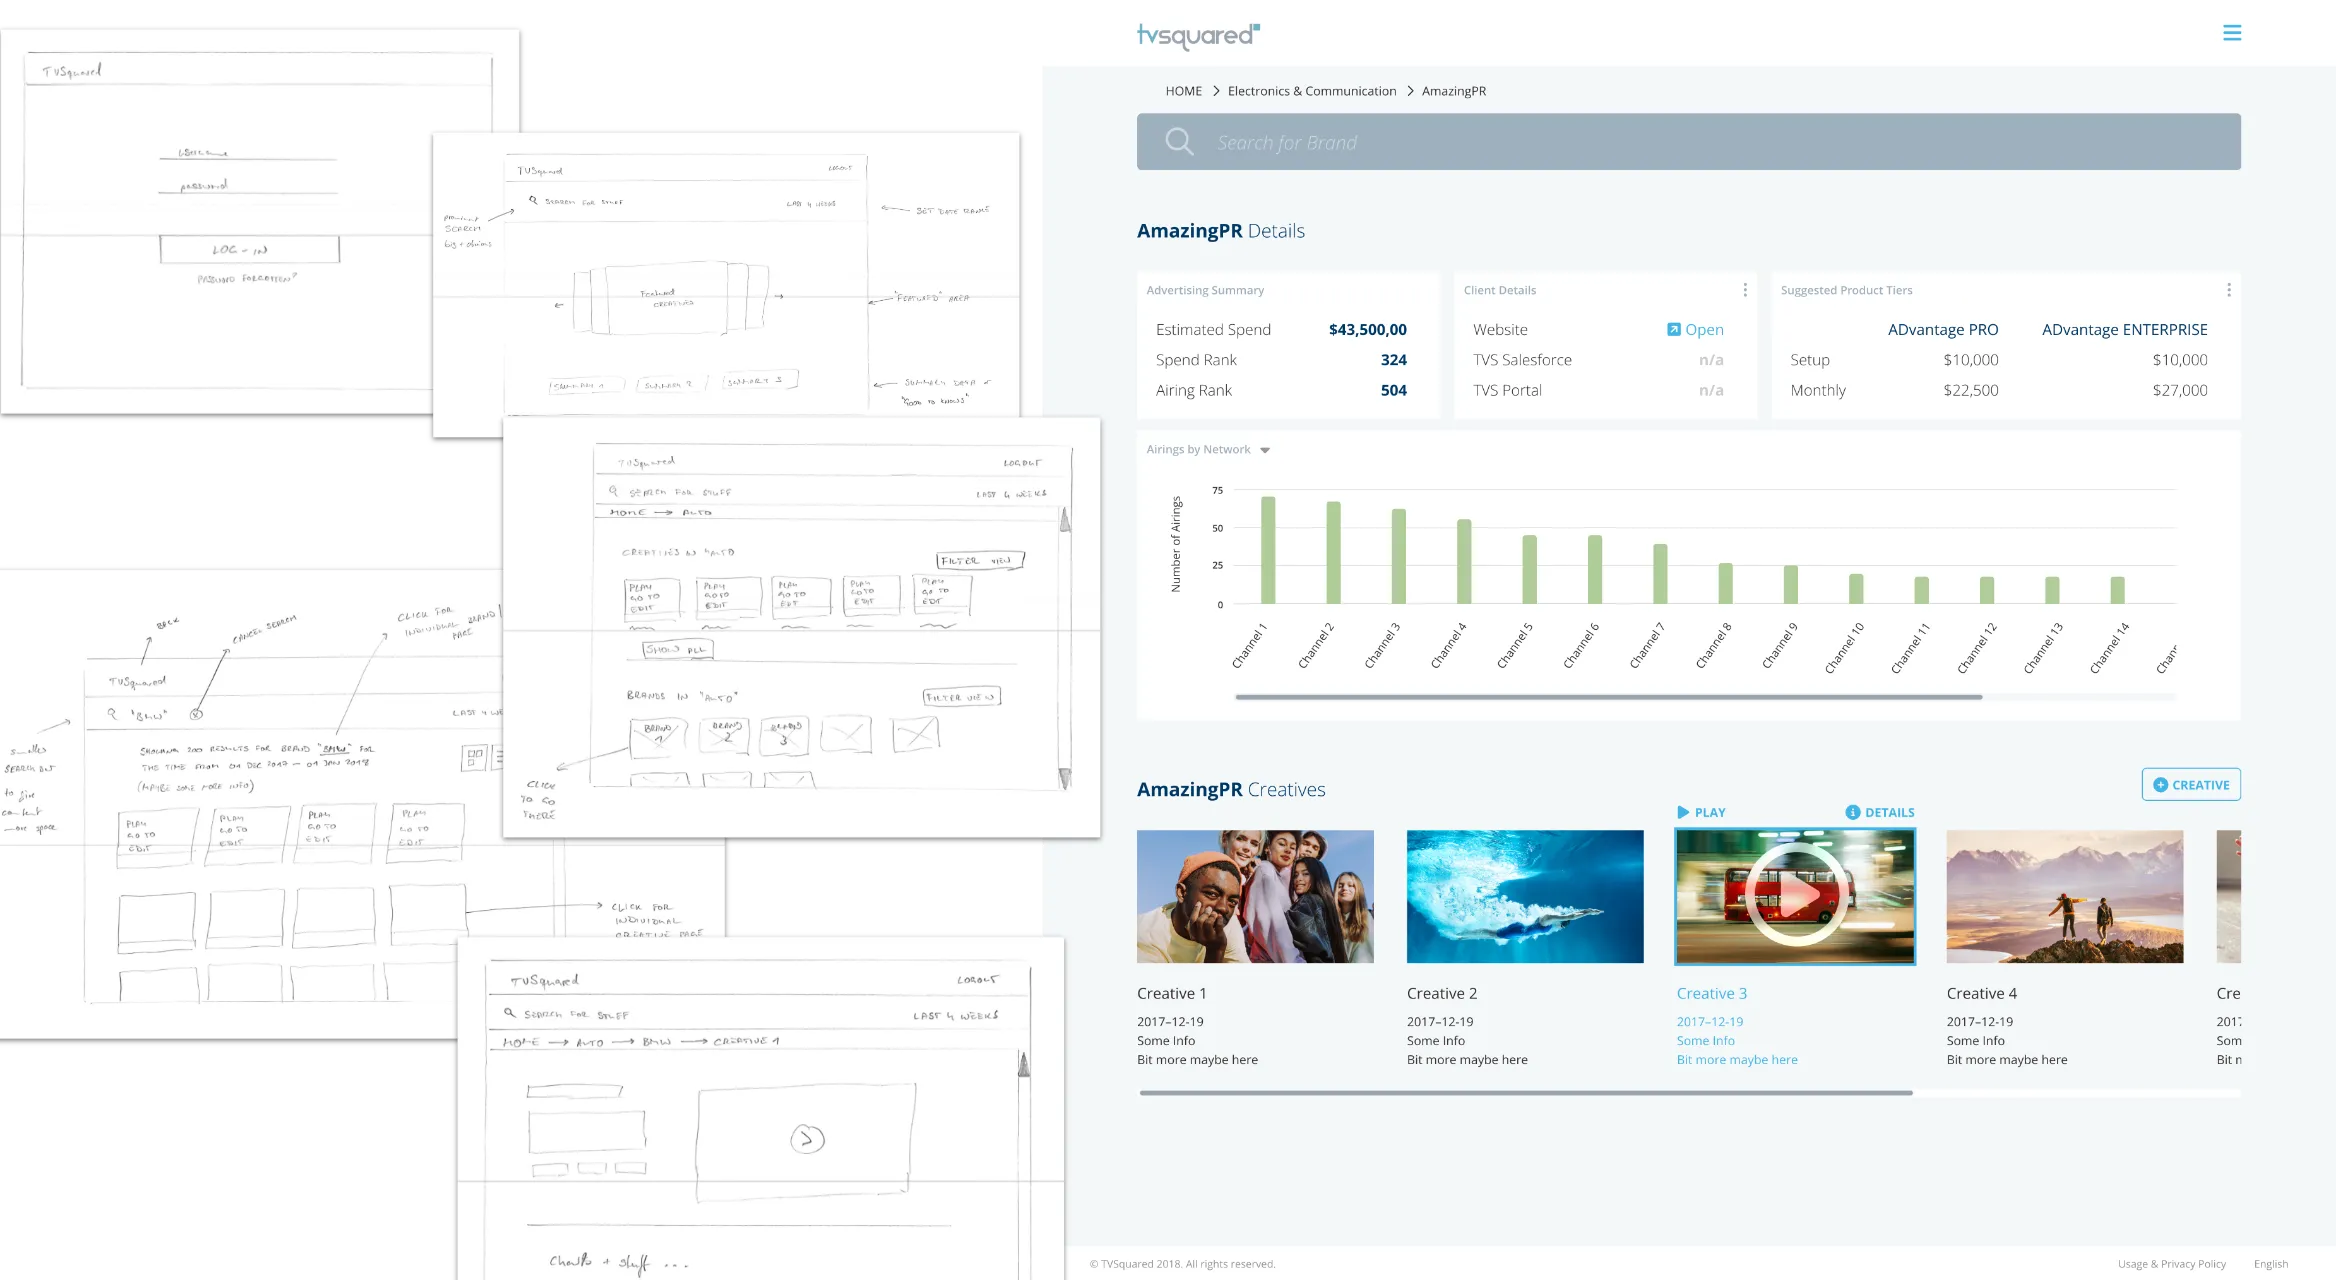
dotTV, also called TVSquared.tv, was meant for discovery. Behind a login, users could explore high- and low-performing TV ads by category, network, sector or brand, open a brand’s page with all its creatives, and watch each ad next to how often and where it aired. Each brand page also showed whether the brand was already a TVSquared client and which ADvantage tier would suit it. It never launched publicly, but Sales used it to show prospects how their ads were doing before they were in our system, and to make the case for upsells with existing clients. It went through several rounds, from rough scribbles to a full set of polished screens.
Enlarge image: Left, a stack of pencil wireframes for dotTV: login, a start page with search and featured creatives, results for a category, and a creative page with a video player, with handwritten notes. Right, a designed brand page: estimated spend and ranks, client details, suggested ADvantage tiers with prices, a bar chart of airings by network, and a row of the brand’s creatives.
From pencil wireframes to a designed brand page.

Predict – showing what a change would do.

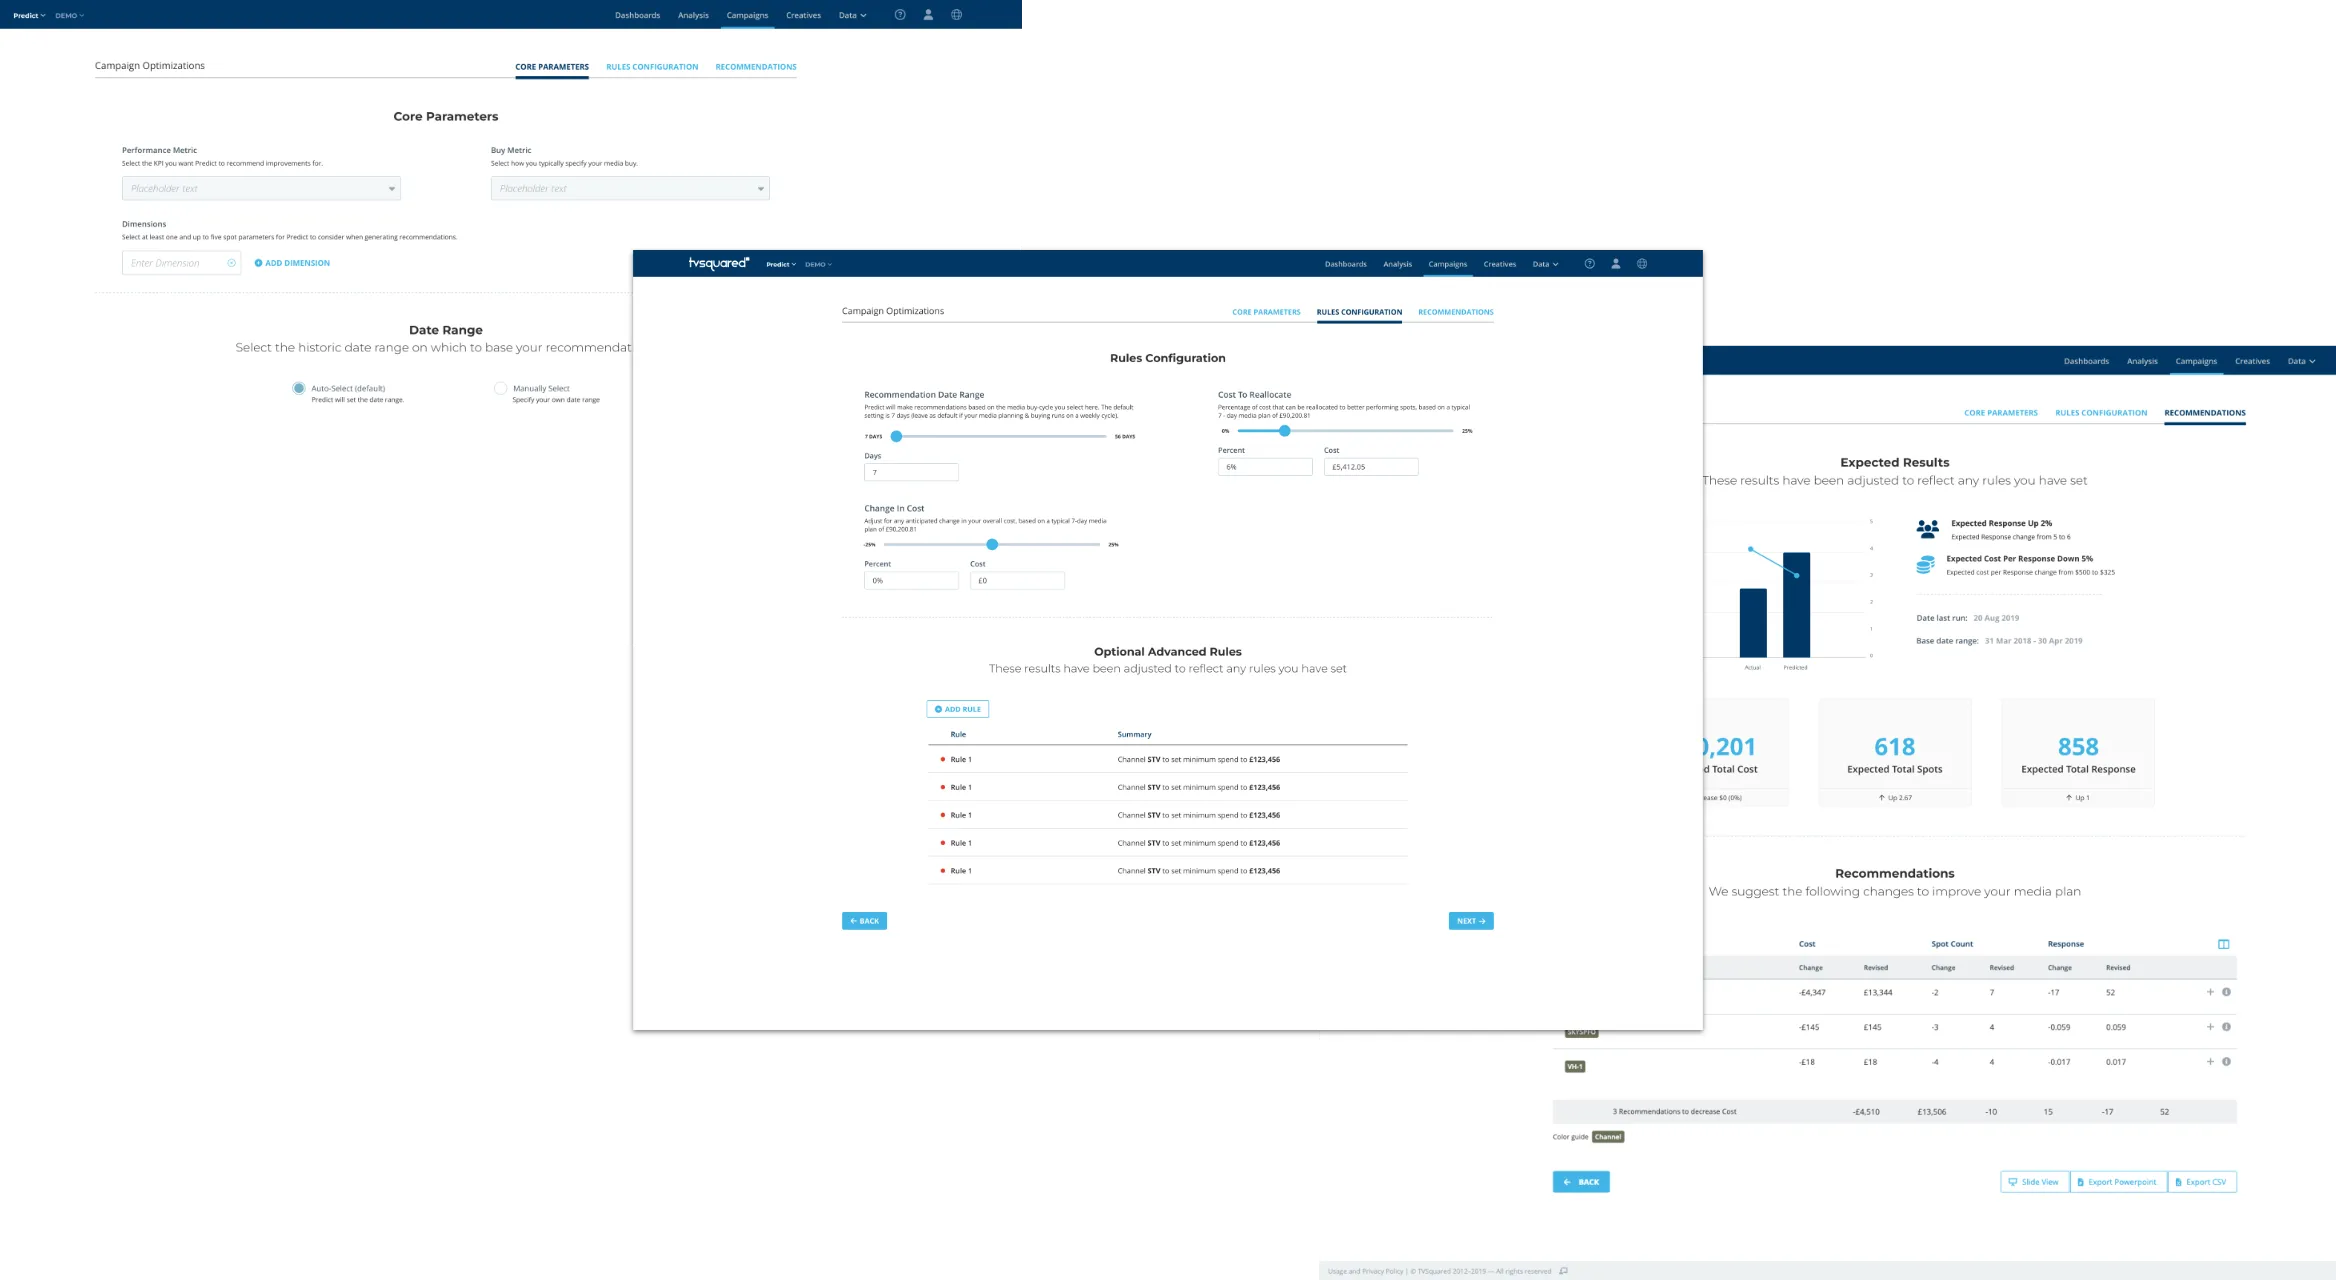
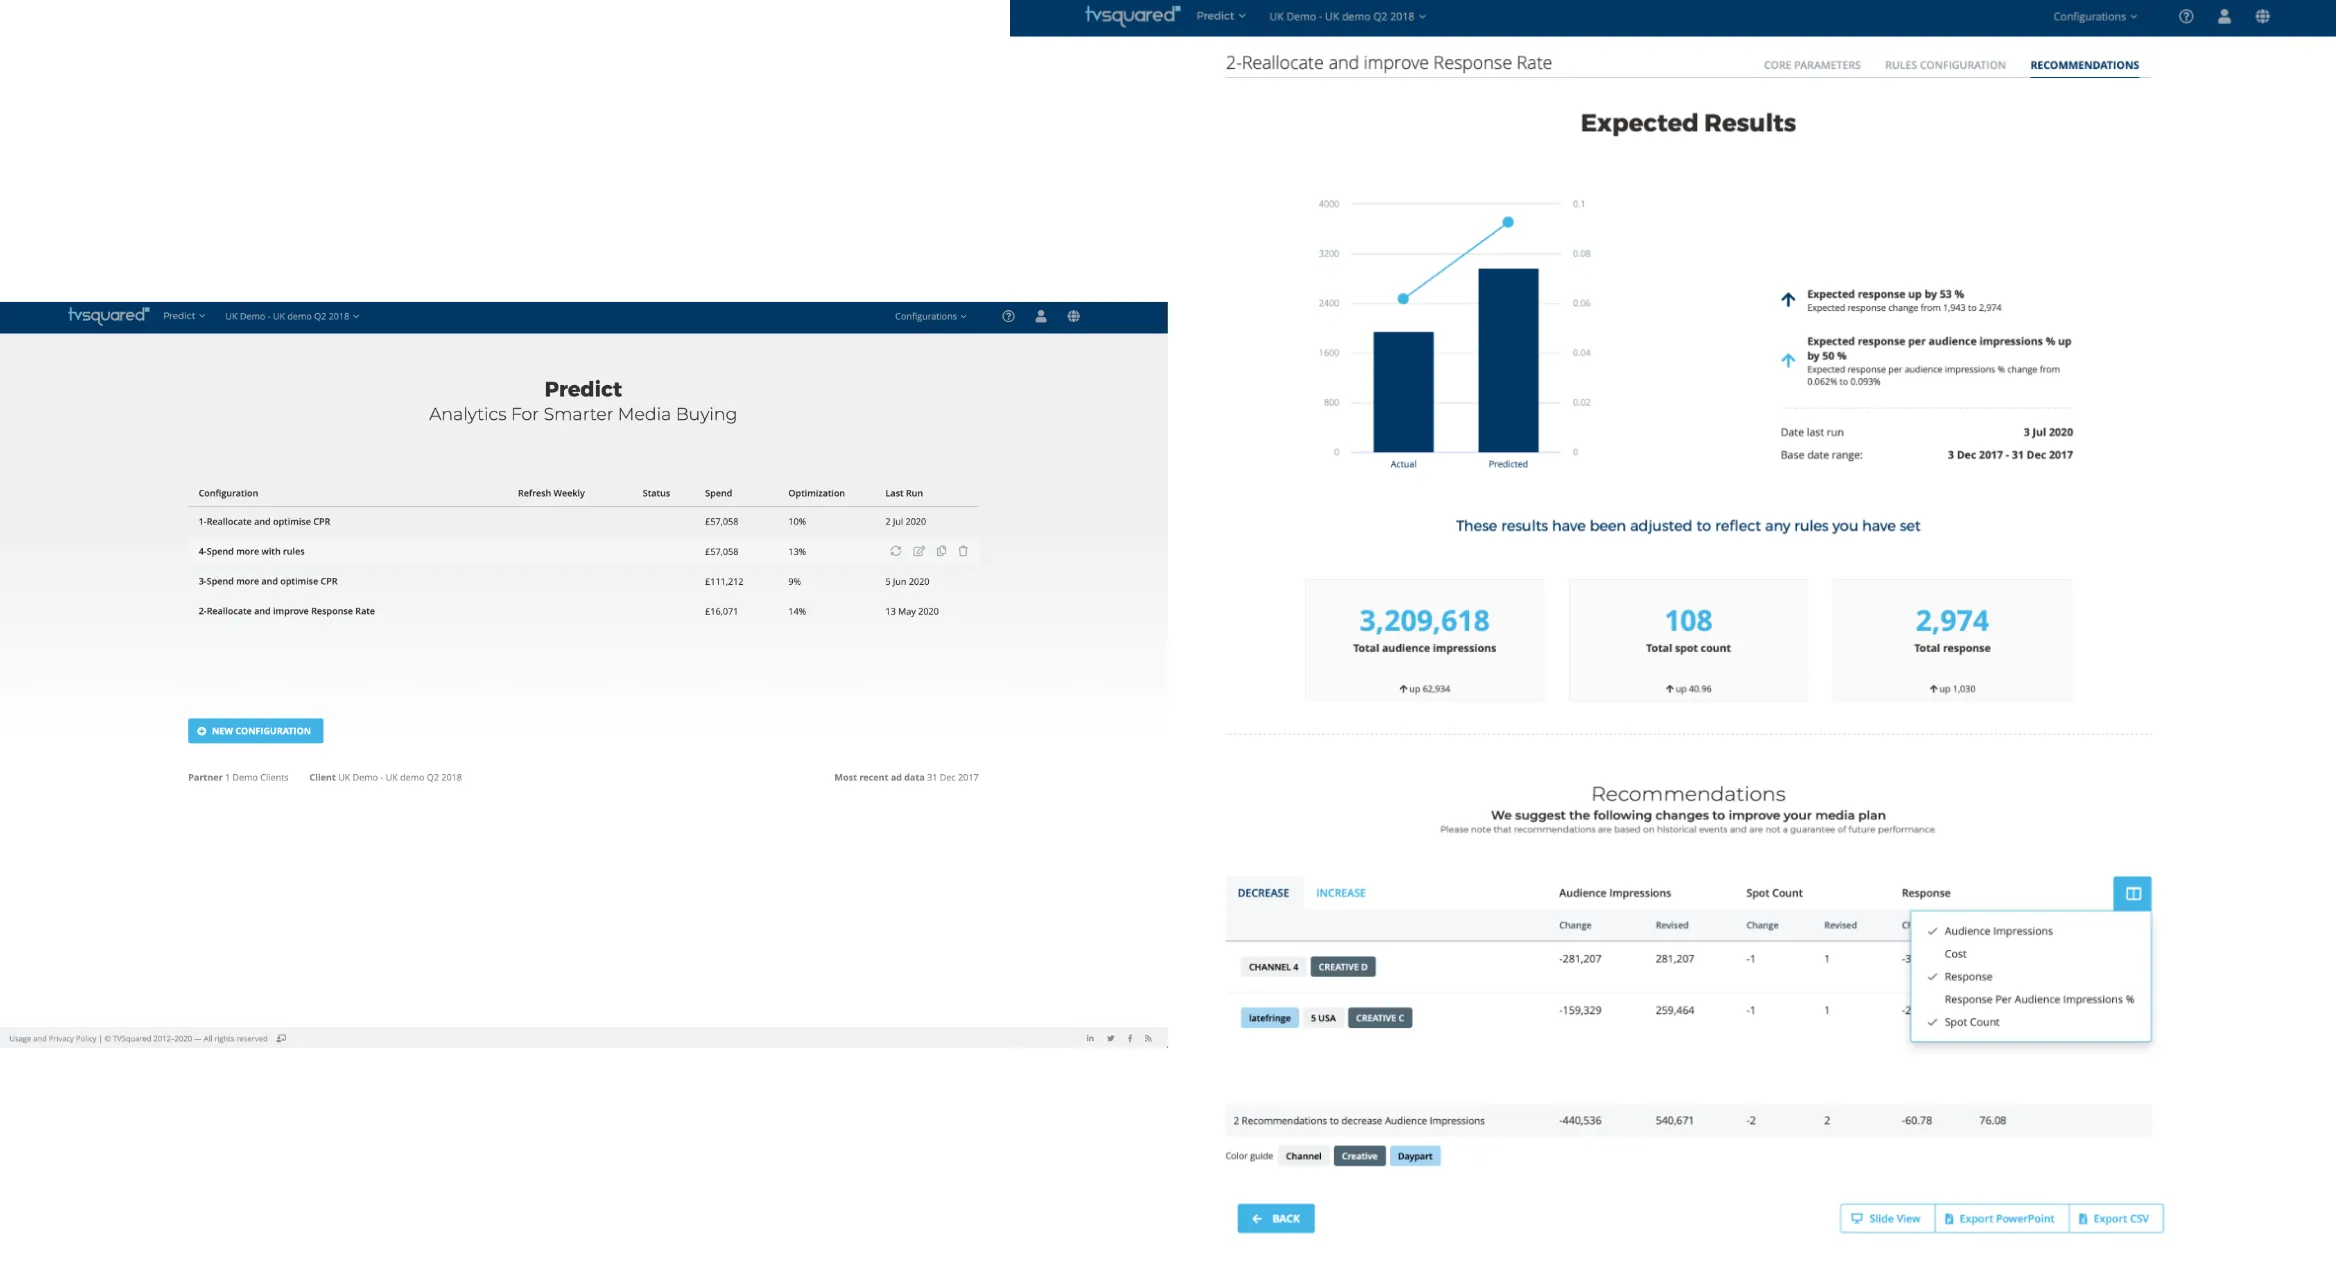
Where most of the other tools looked at an ad’s past performance, Predict looked forward. Clients set a goal, such as a lower cost per response, and the dimensions and rules Predict had to respect, and it forecast what changes to the media plan would do. The first version worked, but it read like a tool for data scientists. My redesign made it calmer and less technical and split the setup into clear steps. I added a check that showed whether there was enough data before a run, a rule builder for setting up scenarios, and an export and a slide view, so results could be presented straight from Predict.

Enlarge image: Three steps of a Predict scenario, overlapping. Core Parameters: performance and buy metric, the dimensions to consider and the date range. Rules Configuration: sliders for the recommendation date range, cost to reallocate and change in cost, and a list of optional advanced rules. Recommendations: expected results with a chart of actual against predicted, and a table of changes per channel.
Setting up a scenario – parameters, rules, recommendations.
Enlarge image: Left, Predict’s start page: a list of saved configurations with their spend, optimisation and last run date, and a button to create a new one. Right, the results of one run: expected response and impressions against the actual figures, and recommended changes per channel, creative and daypart, with a column picker open and buttons for Slide View, Export PowerPoint and Export CSV.
Saved scenarios, and recommendations ready to present or export.

Result

New products, one platform.

ADeffect and Predict went live and were sold next to ADvantage, in the same interface and on the same design system, so clients didn’t have to learn a new tool for each new question. dotTV never launched publicly, but Sales used it with prospects and for upsells.

Looking back

What I’d do differently.

I’d pin down names and scope earlier. ADwatch turned into Creative Management and then SearchSync while I was designing it, and by the time I left even I wasn’t sure which parts had shipped. A one-page brief per product, kept up to date, would have given developers, Sales and me the same picture.

Contact

Let’s make it simple.

Open to freelance projects, full-time roles, and interesting conversations.

Visit me on LinkedIn